


Today’s report: It's been a scary week
A downbeat ECB decision and an uncertain outlook from US big tech firms have only added to the dark cloud that has been this week, with investors already stressing in a big away about coronavirus fallout and next week’s US election.
Wake-up call
- Downbeat ECB
- mortgage approvals
- large sell-stops
- SNB policy
- Aussie PPI
- OIL tumble
- bond purchases
- Stocks vulnerable
- hard asset
- Increased adoption
- Defi space
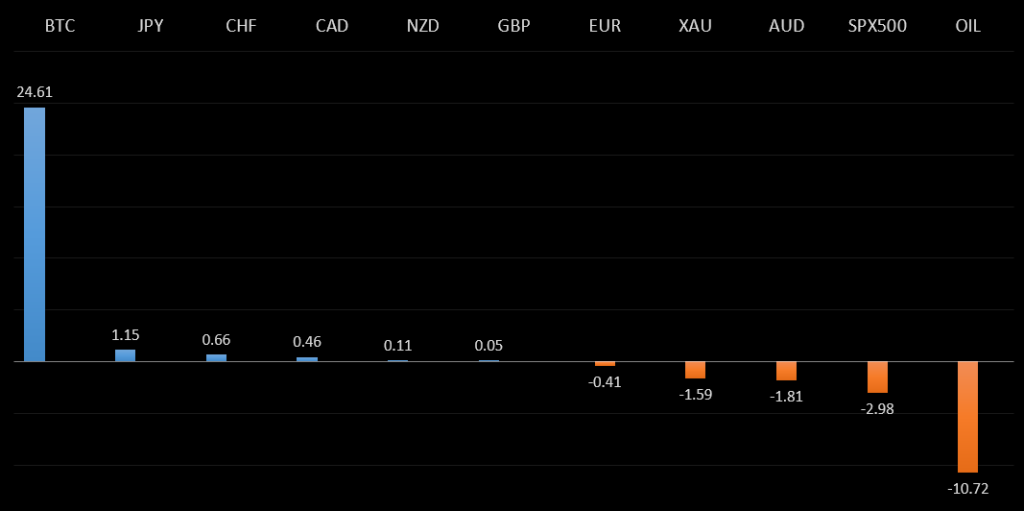
Peformance chart: 30 Day Performance vs. US dollar (%)
Suggested reading
- Survival Is What Matters in Next Week's Tempest, J. Authers, Bloomberg (October 30, 2020)
- Is America Facing A New Housing Crisis?, P. Spiegel, Financial Times (October 30, 2020)
Chart talk: Technical & fundamental highlights
Choose pair:
EURUSD – technical overview
A higher low is now sought out above the multi-year low from 2017, ahead of the next major upside extension. The major pair is currently in the process of a consolidation and correction following an impressive run in 2020. Setbacks should now be well supported ahead of 1.1400.EURUSD – fundamental overview
The Euro has taken another hit after the ECB raised a red flag and warned of downside risks. The central bank left policy unchanged on Thursday but pledged a December easing and said it would consider all instruments. Meanwhile, soft German inflation reads have done nothing to help the Euro's cause either. Key standouts on today’s calendar include German retail sales, an ECB Mersch speech, German GDP, Eurozone GDP, Eurozone inflation, Eurozone unemployment, an ECB Guindos speech, US personal income and spending, US core PCE, Chicago PMIs, and Michigan sentiment.EURUSD - Technical charts in detail
GBPUSD – technical overview
The market recovery out from the March low has stalled out ahead of the 2019 high. Nevertheless, at this stage, setbacks are viewed as corrective, with the price seen very well supported on dips into the 1.2500 area. Look for a higher low ahead of the next major upside extension back through 1.3500 and towards 1.4000 further up.GBPUSD – fundamental overview
Broadly speaking, the Pound has been very well supported, despite setbacks from risk off flow. Optimism around the prospects for a Brexit deal agreement have been keeping the currency in demand. UK mortgage approvals data jumped to 91.5k in September from 76.1 previous. Key standouts on today’s calendar include US personal income and spending, US core PCE, Chicago PMIs, and Michigan sentiment.USDJPY – technical overview
We're seeing signs of a pickup in volatility in the major pair, with the market chopping around quite a bit. Still, there is no clear directional insight, with the price confined to a larger triangle formation. Overall, rallies have been well capped above 110.00 and dips well supported below 104.00.- R2 106.11 – 7 October high – Strong
- R1 105.75 – 20 October high – Medium
- S1 104.00 – 21 October low – Strong
- S2 103.00 – Figure – Strong
We've seen a lot of demand for the Yen this week, on the back of the intense bout of risk liquidation in global markets. Dealers report sizable stops below 104.00. On the data front, Japan industrial production came in above forecast, the jobless rate held steady, and Tokyo's CPI report showed a softening of inflationary pressures. The BOJ kept purchases unchanged at today's operations. Key standouts on today’s calendar include US personal income and spending, US core PCE, Chicago PMIs, and Michigan sentiment.EURCHF – technical overview
The market remains very well capped into offers and the medium-term picture continues to favour the downside. A weekly close back above 1.1000 would be required to take the immediate pressure off the downside.EURCHF – fundamental overview
The SNB remains uncomfortable with Franc appreciation and continues to remind the market it will need to be careful about any attempts at trying to force an appreciation in the currency. But the SNB will also need to be careful right now, as its strategy to weaken the Franc is facing headwinds from a less certain global outlook. Any signs of renewed risk liquidation in 2020, will likely invite a very large wave of demand for the Franc that will put the SNB in the more challenging position of needing to back up its talk with action, that ultimately, may not prove to be as effective as it once was, given where we're at in the monetary policy cycle.AUDUSD – technical overview
Technical studies have turned up in 2020, after the market traded down to its lowest levels since 2003 earlier this year. There is evidence of a longer-term bottom following the latest push back through 0.7000, though at this stage, there is risk for a pullback to allow for shorter term studies to unwind. Next big resistance comes in at 0.7500. Setbacks should now be well supported ahead of 0.6800.AUDUSD – fundamental overview
Aussie private sector credit came in as expected, while Aussie producer prices were a little softer than forecast. Overall, most of the attention here has been about reaction to the downturn in global sentiment, with the correlated commodity currency under pressure as a consequence. Key standouts on today’s calendar include US personal income and spending, US core PCE, Chicago PMIs, and Michigan sentiment.USDCAD – technical overview
Has been in the process of correcting since topping out earlier this year above 1.4600. At this stage, with the correction well extended, the market is likely to find solid support in the 1.3000 area, ahead of a resumption of gains. Ultimately, only a weekly close below 1.3000 would suggest otherwise.USDCAD – fundamental overview
The Loonie has been under pressure this week. A lot of this has come from broad based risk off flow, massive downside pressure in the price of OIL and some dovish tweaks at the Bank of Canada decision earlier this week. Key standouts on today’s calendar include Canada GDP and producer prices, US personal income and spending, US core PCE, Chicago PMIs, and Michigan sentiment.NZDUSD – technical overview
There's a case to be made for a meaningful bottom, after the market collapsed below massive psychological support at 0.5500 earlier this year. The latest break back above the 0.6600 area further strengthens this outlook, with the market back in uptrend mode as per the weekly Ichimoku cloud. Any setbacks are expected to be well supported ahead of 0.6200.NZDUSD – fundamental overview
There hasn't been much reaction to second tier data reads out of New Zealand on Friday, with the market more focused on developments on the global macro front. This week's downturn in global sentiment has been a clear drag on the New Zealand Dollar. The RBNZ announced it will be looking to purchase NZD870 million of government bonds next week, down from NZD880 million this week. Key standouts on today’s calendar include US personal income and spending, US core PCE, Chicago PMIs, and Michigan sentiment.US SPX 500 – technical overview
Longer-term technical studies are looking quite exhausted and the market is showing signs of wanting to roll over after racing to another record high in early September. The September break below the August low set up a bearish outside month formation, which adds to the case for deeper setbacks ahead. Look for rallies to be well capped ahead of the September record high.US SPX 500 – fundamental overview
Although we saw a September push to fresh record highs in response to unlimited QE from the Fed and massive US stimulus, with so little room for additional central bank accommodation, given an already depressed interest rate environment, the prospect for additional runs to the topside, on easy money policy incentives and government stimulus, should no longer be as enticing to investors. Meanwhile, tension on the global trade front, geopolitical risk, and ongoing worry associated with coronavirus recovery should weigh more heavily on investor sentiment in 2020.GOLD (SPOT) – technical overview
The 2019 breakout above the 2016 high at 1375 was a significant development, opening the door for fresh record highs and an acceleration beyond the next major psychological barrier at 2000. Setbacks should now be well supported above 1700. Longer-term technical studies are however in the process of unwinding from overbought readings, with the market in search of a higher low ahead of a bullish continuation.GOLD (SPOT) – fundamental overview
The yellow metal continues to be well supported on dips with solid demand from medium and longer-term accounts. These players are more concerned about exhausted monetary policy, extended global equities, political uncertainty, coronavirus fallout, systemic risk and trade war threats. All of this should keep the commodity well supported, with many market participants also fleeing to the hard asset as the grand dichotomy of record high equities and record low yields comes to an unnerving climax.BTCUSD – technical overview
Bitcoin has arrived at a critical inflection point as it retest the 2019 high. If the market can establish a weekly close back above 14k, it will open the door for a fresh upside extension towards the record high. But technical studies are looking stretched after this most recent run, which suggests that the market may have a hard time extending the run right now, instead deferring to a correction and more consolidation.BTCUSD – fundamental overview
Bitcoin has enjoyed a nice recovery since bottoming in March, with the run-up in stocks and ongoing increased adoption and progress in the space contributing to the strong demand. Most recently, Paypal has now officially announced it will be integrating bitcoin in the weeks ahead. At the same time, the market has also stalled out into important resistance, and we see this as timing well for another period of weakness, especially with global equities once again looking vulnerable.BTCUSD - Technical charts in detail
ETHUSD – technical overview
We've seen an impressive recovery in 2020, with the market pushing up towards $500. This has set the stage for a bigger run to the topside over the medium to longer-term. However, at this stage, the market is currently in the process of correcting since putting in the 2020 high, with a higher low now sought out ahead of that next major upside extension.ETHUSD – fundamental overview
While there is plenty of Ether demand built up, with so much optimism around prospects for the blockchain, given all of the development going on in the decentralised finance space, macroeconomics will likely play a weighing influence into rallies, with Ether expected to underperform in a risk off backdrop, in light of Ethereum's higher sensitivity and correlation with risk themes. Certainly the news of Paypal integrating Ether has given the cryptocurrency more boost, but we've also seen Ethereum's defi space getting a little overcrowded of late, which could further contribute to future downside pressure.