


Next 24 hours: Euro, Pound hit on domestic factors
Today’s report: Yellen updating the inflation narrative
Things haven’t exactly been all that exciting this week. On Monday, stocks were mixed and volumes were lower in a calendar light day. We did however see some selling of the US Dollar, mostly on the back of the news that Russia may order state companies to switch from US Dollar holdings to Euro holdings.
Wake-up call
- Russia news
- full reopening
- Olympic odds
- SNB policy
- Strong exports
- Vaccination rate
- yields rising
- Stocks vulnerable
- Dealers report
- Outlook sours
- weak stocks
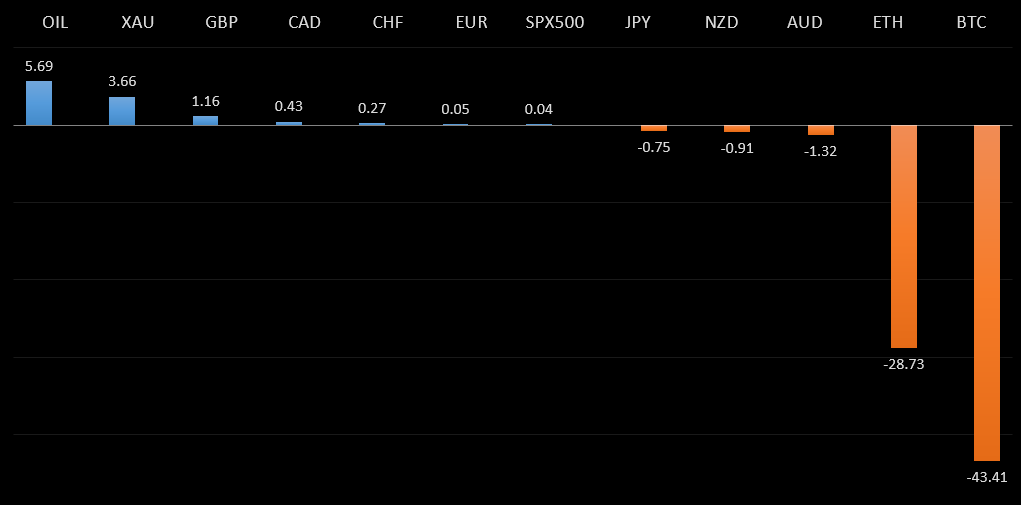
Peformance chart: 30 Day Performance vs. US dollar (%)
Suggested reading
- Bonds for Bitcoin? Hope Michael Saylor Has Friends, B. Chappatta, Bloomberg (June 8, 2021)
- We’ll Know Crypto Is For Real When Its Coins Start Collapsing, J. Tamny, Forbes (June 6, 2021)
Chart talk: Technical & fundamental highlights
Choose pair:
EURUSD – technical overview
The market has been looking for a higher low since topping out in 2021 up at 1.2350. Ideally, this next higher low is sought out ahead of 1.1600 in favour of the next major upside extension back through 1.2350 and towards a retest of the 2018 high at 1.2555 further up.EURUSD – fundamental overview
The Euro managed to find more demand on Monday from reports Russia may order state companies to switch from US Dollar holdings to Euro holdings. The fall in German factory orders was overlooked and perhaps offset by investor confidence data. Key standouts on today’s calendar include German industrial production, Eurozone employment, Eurozone GDP, Eurozone and German ZEW sentiment, Canada trade, US trade, and US JOLTs job openings.EURUSD - Technical charts in detail
GBPUSD – technical overview
Technical studies are in the process of consolidating from stretched levels after the push to fresh multi-month highs. This leaves room for additional consolidation, before the market considers a meaningful bullish continuation towards a retest of the 2018 high. But look for setbacks to now be very well supported into the 1.3500 area.GBPUSD – fundamental overview
Most of this latest demand for the Pound has come from strong housing data showing UK house prices rising at their fastest rate in seven years. At the same time, there have been some headwinds as plans for a full reopening in the UK are still in doubt. Key standouts on today’s calendar include German industrial production, Eurozone employment, Eurozone GDP, Eurozone and German ZEW sentiment, Canada trade, US trade, and US JOLTs job openings.USDJPY – technical overview
The major pair has run into massive resistance in the form of the monthly Ichimoku cloud, and has since stalled out. This translates to a longer-term trend that is still bearish despite the run up we saw in 2021, with risk for deeper setbacks ahead. It would take a clear break back above 113.00 to negate the outlook.USDJPY – fundamental overview
Dealers were reporting some demand for the Yen to start the week on the back of better news relating to the vaccine, a lower infection rate, and better odds of the Olympics happening. Otherwise, there wasn't much going on with respect to Yen related flow. Key standouts on today’s calendar include German industrial production, Eurozone employment, Eurozone GDP, Eurozone and German ZEW sentiment, Canada trade, US trade, and US JOLTs job openings.EURCHF – technical overview
Lots of sideways price action here, with no clear directional insight. For the most part, price action has been confined between 1.0600 and 1.1200, and it will take a weekly close above or below for an indication of the next big move.EURCHF – fundamental overview
The SNB remains uncomfortable with Franc appreciation and continues to remind the market it will need to be careful about any attempts at trying to force an appreciation in the currency. But the SNB will also need to be careful right now, as its strategy to weaken the Franc is facing headwinds from a less certain global outlook. Any signs of renewed risk liquidation will likely invite a very large wave of demand for the Franc that will put the SNB in the more challenging position of needing to back up its talk with action, that ultimately, may not prove to be as effective as it once was, given where we're at in the monetary policy cycle.AUDUSD – technical overview
Technical studies have turned up in recent months, after the market traded down to its lowest levels since 2003 in 2020. There is evidence of a longer-term bottom following the latest push back through 0.7000, though at this stage, there is risk for a deeper pullback to allow for shorter term studies to unwind. Setbacks should now be well supported ahead of 0.7400.AUDUSD – fundamental overview
The Australian Dollar was boosted on Monday from the strong Aussie export data. Meanwhile, ANZ job ads were also up. Still, with base metals under pressure, there has been some Aussie related selling activity in rallies. Key standouts on today’s calendar include German industrial production, Eurozone employment, Eurozone GDP, Eurozone and German ZEW sentiment, Canada trade, US trade, and US JOLTs job openings.USDCAD – technical overview
Has been in major decline since topping out in 2021 above 1.4600. At this stage, with the decline now well extended, the market is likely to find solid support into the 1.2000 area ahead of a resumption of gains. Ultimately, only a weekly close below 1.2000 would suggest otherwise. Back above 1.2352 will strengthen the outlook.USDCAD – fundamental overview
The Canadian Dollar was an underperformer on Monday as the price of OIL stalled out. On the positive side, we did get some good news out of Ontario, with restrictions expected to ease as the vaccination rate accelerates. Key standouts on today’s calendar include German industrial production, Eurozone employment, Eurozone GDP, Eurozone and German ZEW sentiment, Canada trade, US trade, and US JOLTs job openings.NZDUSD – technical overview
The market has been very well supported in recent months and there is evidence of a longer-term base. Look for setbacks to hold up above 0.7100, with sights set on a run back towards the 0.7500 area.NZDUSD – fundamental overview
The New Zealand Dollar was higher on Monday with New Zealand yields rising for the third consecutive day. Still, there have been offers into rallies as commodities prices struggle. Key standouts on today’s calendar include German industrial production, Eurozone employment, Eurozone GDP, Eurozone and German ZEW sentiment, Canada trade, US trade, and US JOLTs job openings.US SPX 500 – technical overview
Longer-term technical studies are looking quite exhausted and the market is showing signs of wanting to roll over after racing to another record high. Look for rallies to be well capped above of 4200, with a break back below 4000 to strengthen the outlook.US SPX 500 – fundamental overview
We're trading just off fresh record highs, and yet, with so little room for additional central bank accommodation, given an already depressed interest rate environment, the prospect for sustainable runs to the topside on easy money policy incentives and government stimulus, should no longer be as enticing to investors. Meanwhile, ongoing worry associated with coronavirus fallout and risk of rising inflation should weigh more heavily on investor sentiment into the second half of 2021.GOLD (SPOT) – technical overview
The 2019 breakout above the 2016 high at 1375 was a significant development, opening the door for fresh record highs and an acceleration beyond the next major psychological barrier at 2000. Setbacks should now be well supported above 1600.GOLD (SPOT) – fundamental overview
The yellow metal continues to be well supported on dips with solid demand from medium and longer-term accounts. These players are more concerned about exhausted monetary policy, extended global equities, and coronavirus fallout. All of this should keep the commodity well supported, with many market participants also fleeing to the hard asset as the grand dichotomy of record high equities and record low yields comes to an unnerving climax.BTCUSD – technical overview
Risk for any meaningful bullish continuation beyond the recent record high just ahead of $65,000 should be limited over the coming months, with the higher probability leaning towards more consolidation. Look for setbacks to be very well supported above $30,000 on a weekly close basis.BTCUSD – fundamental overview
Heading into 2021, there was a great anticipation for institutional adoption. And as we saw follow through on this anticipation, the bitcoin price tripled in value, exploding to a record high beyond $60,000. But with much of that now priced into the market, and with short-term bitcoin fundamentals still correlating with global risk sentiment, there does appear to be room for some sideways trade in the price before we see that next wave of renewed demand. We also believe bitcoin's emergence into the mainstream invites more challenge and scrutiny from central banks and governments, which could translate to more bumps into H2 2021 before the asset once again finds its legs on the compelling longer-term value proposition.BTCUSD - Technical charts in detail
ETHUSD – technical overview
At this stage, additional upside should be limited to allow for still extended monthly studies to unwind before the market considers a meaningful bullish continuation. Look for setbacks to be well supported above $1,500 on a weekly close basis.ETHUSD – fundamental overview
Ether has entered a phase of meaningful correction after an explosive start to 2021 that has resulted in fresh record highs beyond $4,000. There are already signs of overvaluation in the defi space and this in conjunction with an anticipated deterioration in global risk sentiment are been behind a lot of the reasoning for the anticipated downside pressure. Still, we believe there will be plenty of demand for ether down into the $2,000 area.