


Special report: FOMC decision preview
Today’s report: Look for things to heat up
It’s been a quiet week for financial markets, and while things have been moving around a bit, it’s all been a big wait and see game ahead of today’s highly anticipated FOMC event risk.
Wake-up call
- ECB Lagarde
- BOE pricing
- inflation goal
- Tuesday's RBA
- housing data
- jobs report
- Stocks vulnerable
- Dealers report
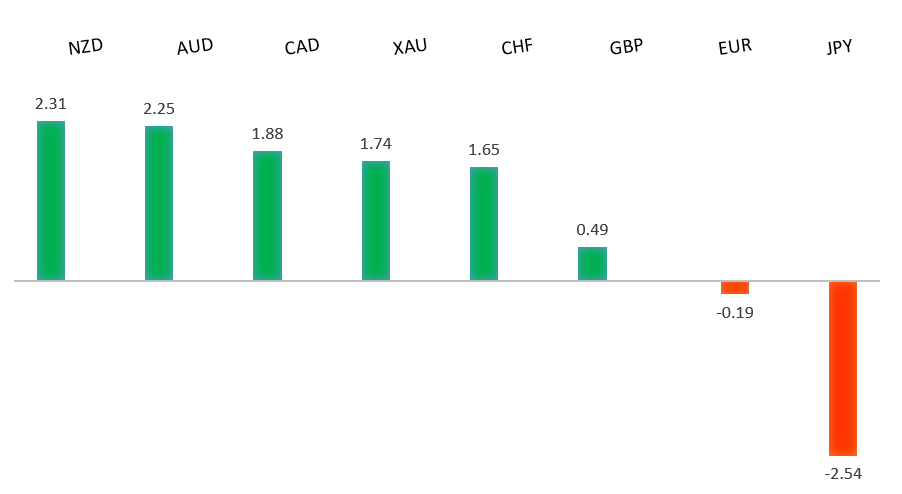
Peformance chart: 30 Day Performance vs. US dollar (%)
Suggested reading
- Central Banks Are Playing Catch-Up in Different Ways, M. El-Erian, Bloomberg (November 2, 2021)
- To Fix Supply Chain, Move the Economists Out of the Way, C. Weise, RCM (November 2, 2021)
Chart talk: Technical & fundamental highlights
Choose pair:
EURUSD – technical overview
The market has been looking for a higher low since topping out in 2021 up at 1.2350. Ideally, setbacks continue to be well supported above 1.1500 on a weekly close basis in favour of the next major upside extension back through 1.2350 and towards a retest of the 2018 high at 1.2555 further up. Only a weekly close below 1.1500 would force a rethink.EURUSD – fundamental overview
The Euro was dragged lower on Tuesday on account of a sharp break in Bund yields. Eurozone and German manufacturing PMIs also came in soft. Key standouts on today’s calendar include an ECB Lagarde speech, UK PMI reads, Eurozone unemployment, US ADP employment, factory orders, ISM non-manufacturing, and the Fed decision late in the day.EURUSD - Technical charts in detail
GBPUSD – technical overview
The market is in a consolidation phase in the aftermath of the run to fresh 2021 and multi-month highs. At this stage, additional setbacks should be limited to the 1.3200 area ahead of the next major upside extension towards a retest and break of critical resistance in the form of the 2018 high.GBPUSD – fundamental overview
The Pound has extended its recent run of declines on a shift in expectations ahead of the BOE decision tomorrow. There was already sentiment the BOE wouldn't lean as hawkish as initially expected and Tuesday's dovish leaning RBA decision has only added to that sentiment. Key standouts on today’s calendar include an ECB Lagarde speech, UK PMI reads, Eurozone unemployment, US ADP employment, factory orders, ISM non-manufacturing, and the Fed decision late in the day.USDJPY – technical overview
The longer-term trend is bearish despite the recent run higher. Look for additional upside to be limited, with scope for a topside failure and bearish resumption back down towards the 100.00 area. It would take a clear break back above 114.55 to negate the outlook.USDJPY – fundamental overview
The Kishida government has committed to the prior 2% inflation goal. We haven't seen much movement in the Yen, though there was some demand for Yen on weaker APAC stocks. Key standouts on today’s calendar include an ECB Lagarde speech, UK PMI reads, Eurozone unemployment, US ADP employment, factory orders, ISM non-manufacturing, and the Fed decision late in the day.AUDUSD – technical overview
The Australian Dollar has been in the process of a healthy consolidation following the impressive run towards a retest of the 2018 high earlier this year. At this stage, there are signs of the market wanting to turn back up and any setbacks should be well supported down into the 0.7200 area. Look for a weekly close above 0.7500 to strengthen the outlook and force a shift in the structure.AUDUSD – fundamental overview
The Australian Dollar is trying to recover in the aftermath of intense setbacks from Tuesday's more dovish leaning RBA policy decision. Wednesday's Aussie building approvals data has come in softer than expected, though this hasn't factored into price action. Key standouts on today’s calendar include an ECB Lagarde speech, UK PMI reads, Eurozone unemployment, US ADP employment, factory orders, ISM non-manufacturing, and the Fed decision late in the day.USDCAD – technical overview
Finally signs of a major bottom in the works after a severe decline from the 2020 high. A recent weekly close back above 1.2500 encourages the constructive outlook and opens the door for a push back towards next critical resistance in the 1.3000 area. Any setbacks should be well supported into the 1.2200s.USDCAD – fundamental overview
Solid housing data out of Canada on Tuesday, though this didn't really factor into price action. Key standouts on today’s calendar include an ECB Lagarde speech, UK PMI reads, Eurozone unemployment, US ADP employment, factory orders, ISM non-manufacturing, and the Fed decision late in the day.NZDUSD – technical overview
The market has entered a period of consolidation after running up to a yearly and multi-month high. Back above the April high at 0.7317 would be required to force a shift in the structure.NZDUSD – fundamental overview
The New Zealand Dollar has traded higher on Wednesday after taking in a much better than expected jobs report. That being said, the gains have been tempered by the fact that the market has already been pricing a hawkish RBNZ and perhaps also offset by the rise in New Zealand coronavirus cases. Key standouts on today’s calendar include an ECB Lagarde speech, UK PMI reads, Eurozone unemployment, US ADP employment, factory orders, ISM non-manufacturing, and the Fed decision late in the day.US SPX 500 – technical overview
Longer-term technical studies are looking quite exhausted and the market is showing signs of wanting to roll over after racing to another record high. At the same time, the latest breakout above 4600 introduces the possibility for the next major upside extension through 4800. At this stage, it will take a break back below 4272 to take the immediate pressure off the topside.US SPX 500 – fundamental overview
We're trading just off fresh record highs, and yet, with so little room for additional central bank accommodation, given an already depressed interest rate environment, the prospect for sustainable runs to the topside on easy money policy incentives and government stimulus, should no longer be as enticing to investors. Meanwhile, ongoing worry associated with coronavirus fallout and risk of rising inflation should weigh more heavily on investor sentiment in Q4 2021.GOLD (SPOT) – technical overview
The 2019 breakout above the 2016 high at 1375 was a significant development, opening the door for fresh record highs and an acceleration beyond the next major psychological barrier at 2000. Setbacks should now be well supported above 1600.GOLD (SPOT) – fundamental overview
The yellow metal continues to be well supported on dips with solid demand from medium and longer-term accounts. These players are more concerned about exhausted monetary policy, extended global equities, and coronavirus fallout. All of this should keep the commodity well supported, with many market participants also fleeing to the hard asset as the grand dichotomy of record high equities and record low yields comes to an unnerving climax.