


Special report: Bank of England decision preview
Today’s report: Fed still talking transitory inflation
The Fed decision has come and gone and the market reaction should come as no surprise given the central bank’s communication. As widely expected, the Fed left rates on hold, while announcing the start to a taper.
Wake-up call
- ECB speak
- BOE decision
- two-way flow
- Tuesday's RBA
- Oil pullback
- RBNZ outlook
- Stocks vulnerable
- Dealers report
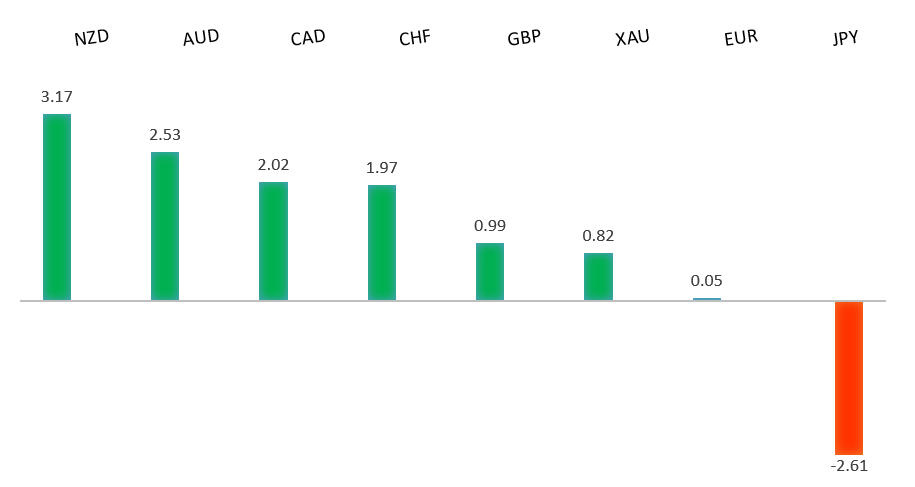
Peformance chart: 30 Day Performance vs. US dollar (%)
Suggested reading
- Fed Sets a Date With Bond Vigilantes in Eight Months, B. Chappatta, Bloomberg (November 3, 2021)
- Federal Power Grab of Future of Stablecoins, M. Homer, RCM (November 3, 2021)
Chart talk: Technical & fundamental highlights
Choose pair:
EURUSD – technical overview
The market has been looking for a higher low since topping out in 2021 up at 1.2350. Ideally, setbacks continue to be well supported above 1.1500 on a weekly close basis in favour of the next major upside extension back through 1.2350 and towards a retest of the 2018 high at 1.2555 further up. Only a weekly close below 1.1500 would force a rethink.EURUSD – fundamental overview
We heard some dovish speak out from ECB Lagarde on Wednesday, but this was more than offset by a Fed decision that wasn't able to give up on the idea of transitory inflation. Key standouts on today’s calendar come from more German, Eurozone and UK PMI reads, Eurozone producer prices, the BOE policy decision, Canada trade, US trade, and US initial jobless claims.EURUSD - Technical charts in detail
GBPUSD – technical overview
The market is in a consolidation phase in the aftermath of the run to fresh 2021 and multi-month highs. At this stage, additional setbacks should be limited to the 1.3200 area ahead of the next major upside extension towards a retest and break of critical resistance in the form of the 2018 high.GBPUSD – fundamental overview
UK PMI and housing data was impressive on Wednesday, and this in conjunction with Dollar selling in the aftermath of a dovish Fed decision, contributed to Pound outperformance. Key standouts on today’s calendar come from more German, Eurozone and UK PMI reads, Eurozone producer prices, the BOE policy decision, Canada trade, US trade, and US initial jobless claims.USDJPY – technical overview
The longer-term trend is bearish despite the recent run higher. Look for additional upside to be limited, with scope for a topside failure and bearish resumption back down towards the 100.00 area. It would take a clear break back above 114.55 to negate the outlook.USDJPY – fundamental overview
The Yen wasn't sure how to react on Wednesday, getting sold on the widening yield differential with the US and more record gains in US stocks, but getting bought on broad based US Dollar selling from the dovish Fed communication. Key standouts on today’s calendar come from more German, Eurozone and UK PMI reads, Eurozone producer prices, the BOE policy decision, Canada trade, US trade, and US initial jobless claims.AUDUSD – technical overview
The Australian Dollar has been in the process of a healthy consolidation following the impressive run towards a retest of the 2018 high earlier this year. At this stage, there are signs of the market wanting to turn back up and any setbacks should be well supported down into the 0.7200 area. Look for a weekly close above 0.7500 to strengthen the outlook and force a shift in the structure.AUDUSD – fundamental overview
The Australian Dollar is trying to recover in the aftermath of intense setbacks from Tuesday's more dovish leaning RBA policy decision. The dovish Fed decision read has definitely been helping, with Aussie up on broad USD outflows and record US stocks. Key standouts on today’s calendar come from more German, Eurozone and UK PMI reads, Eurozone producer prices, the BOE policy decision, Canada trade, US trade, and US initial jobless claims.USDCAD – technical overview
Finally signs of a major bottom in the works after a severe decline from the 2020 high. A recent weekly close back above 1.2500 encourages the constructive outlook and opens the door for a push back towards next critical resistance in the 1.3000 area. Any setbacks should be well supported into the 1.2200s.USDCAD – fundamental overview
Though we did see demand for the Canadian Dollar on Wednesday, the Loonie was a clear underperformer, with the relative weakness coming from a sharp bearish reversal in the price of oil. Key standouts on today’s calendar come from more German, Eurozone and UK PMI reads, Eurozone producer prices, the BOE policy decision, Canada trade, US trade, and US initial jobless claims.NZDUSD – technical overview
The market has entered a period of consolidation after running up to a yearly and multi-month high. Back above the April high at 0.7317 would be required to force a shift in the structure.NZDUSD – fundamental overview
The New Zealand Dollar has traded higher after taking in a much better than expected jobs report earlier in the week and then getting an added boost from broad USD selling post a dovish Fed decision. That being said, the gains have been tempered by the fact that the market has already been pricing a hawkish RBNZ and perhaps also offset by the rise in New Zealand coronavirus cases. Key standouts on today’s calendar come from more German, Eurozone and UK PMI reads, Eurozone producer prices, the BOE policy decision, Canada trade, US trade, and US initial jobless claims.US SPX 500 – technical overview
Longer-term technical studies are looking quite exhausted and the market is showing signs of wanting to roll over after racing to another record high. At the same time, the latest breakout above 4600 introduces the possibility for the next major upside extension through 4800. At this stage, it will take a break back below 4272 to take the immediate pressure off the topside.US SPX 500 – fundamental overview
We're trading just off fresh record highs, and yet, with so little room for additional central bank accommodation, given an already depressed interest rate environment, the prospect for sustainable runs to the topside on easy money policy incentives and government stimulus, should no longer be as enticing to investors. Meanwhile, ongoing worry associated with coronavirus fallout and risk of rising inflation should weigh more heavily on investor sentiment in Q4 2021.GOLD (SPOT) – technical overview
The 2019 breakout above the 2016 high at 1375 was a significant development, opening the door for fresh record highs and an acceleration beyond the next major psychological barrier at 2000. Setbacks should now be well supported above 1600.GOLD (SPOT) – fundamental overview
The yellow metal continues to be well supported on dips with solid demand from medium and longer-term accounts. These players are more concerned about exhausted monetary policy, extended global equities, and coronavirus fallout. All of this should keep the commodity well supported, with many market participants also fleeing to the hard asset as the grand dichotomy of record high equities and record low yields comes to an unnerving climax.