


Next 24 hours: Focusing on US inflation data
Today’s report: US producer prices in spotlight
The melt-up in US equities has persisted into the new week, with the move coming from the latest dovish communication out from the Federal Reserve. This has weighed on the US Dollar as well, with the Buck also taking an added hit on the passage in Congress of the $1.2 trillion infrastructure spending.
Wake-up call
- Sentix confidence
- hawkish talk
- economic assessment
- NAB data
- confidence read
- Covid restrictions
- Stocks vulnerable
- Dealers report
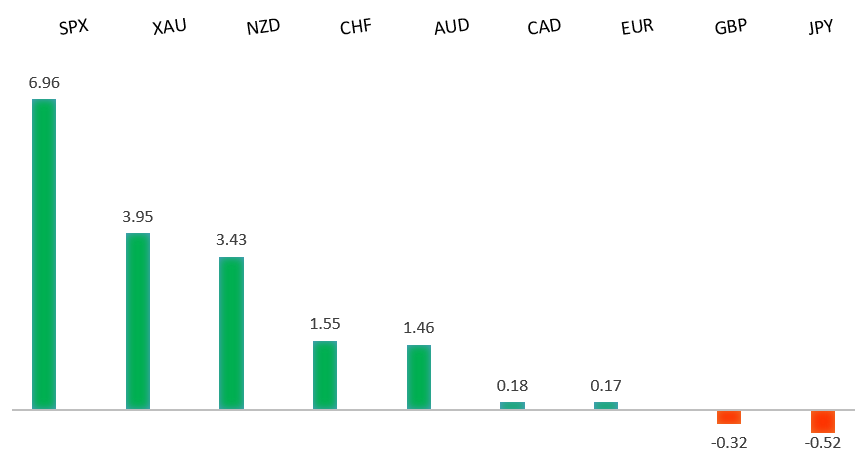
Peformance chart: 30 Day Performance vs. US dollar (%)
Suggested reading
- Gold's Bad Vaccine Year May Contain a Troubling Message, J. Authers, Bloomberg (November 9, 2021)
- EG Group: Building an Empire on Debt-Fueled Growth, K. Wiggins, Financial Times (November 8, 2021)
Chart talk: Technical & fundamental highlights
Choose pair:
EURUSD – technical overview
The market has been looking for a higher low since topping out in 2021 up at 1.2350. Ideally, setbacks continue to be well supported above 1.1500 on a weekly close basis in favour of the next major upside extension back through 1.2350 and towards a retest of the 2018 high at 1.2555 further up. Only a weekly close below 1.1500 would force a rethink.EURUSD – fundamental overview
The Euro was up on Monday after a solid round of European survey data. Sentix investor confidence came in above the previous print and a nice amount above forecast. Meanwhile, ECB Lane was out keeping with the dovish script, though this didn't factor into price action. Key standouts on today’s calendar come in the form of German trade, Eurozone and German ZEWs, US producer prices, a Fed Powell speech and a BOE Bailey speech.EURUSD - Technical charts in detail
GBPUSD – technical overview
The market is in a consolidation phase in the aftermath of the run to fresh 2021 and multi-month highs. At this stage, additional setbacks should be limited to the 1.3200 area ahead of the next major upside extension towards a retest and break of critical resistance in the form of the 2018 high.GBPUSD – fundamental overview
It seems the market is back to buying into hawkish talk from BOE Bailey, this after his hawkish talk was negated by last week's decision. Still, Bailey was out on Monday reminding the market that the central bank would be forced to act if inflation expectations continued to rise. Key standouts on today’s calendar come in the form of German trade, Eurozone and German ZEWs, US producer prices, a Fed Powell speech and a BOE Bailey speech.USDJPY – technical overview
The longer-term trend is bearish despite the recent run higher. Look for additional upside to be limited, with scope for a topside failure and bearish resumption back down towards the 100.00 area. It would take a clear break back above 114.55 to negate the outlook.USDJPY – fundamental overview
The Japanese government lowered the current economic assessment to 'weakening,' the first downgrade in over two years. Meanwhile, economic data to start the week has been soft in Japan and the Nikkei has come under pressure, which has added to the latest wave of Yen demand. Key standouts on today’s calendar come in the form of German trade, Eurozone and German ZEWs, US producer prices, a Fed Powell speech and a BOE Bailey speech.AUDUSD – technical overview
The Australian Dollar has been in the process of a healthy consolidation following the impressive run towards a retest of the 2018 high earlier this year. At this stage, there are signs of the market wanting to turn back up and any setbacks should be well supported down into the 0.7200 area. Look for a weekly close above 0.7500 to strengthen the outlook and force a shift in the structure.AUDUSD – fundamental overview
Australia NAB data has been looking good this week, which has helped to prop up the Australian Dollar. Key standouts on today’s calendar come in the form of German trade, Eurozone and German ZEWs, US producer prices, a Fed Powell speech and a BOE Bailey speech.USDCAD – technical overview
Finally signs of a major bottom in the works after a severe decline from the 2020 high. A recent weekly close back above 1.2500 encourages the constructive outlook and opens the door for a push back towards next critical resistance in the 1.3000 area. Any setbacks should be well supported into the 1.2200s.USDCAD – fundamental overview
We saw a mild round of demand for the Canadian Dollar on Monday, this on the back of the jump in Canada consumer confidence data. Key standouts on today’s calendar come in the form of German trade, Eurozone and German ZEWs, US producer prices, a Fed Powell speech and a BOE Bailey speech.NZDUSD – technical overview
The market has entered a period of consolidation after running up to a yearly and multi-month high. Back above the April high at 0.7317 would be required to force a shift in the structure.NZDUSD – fundamental overview
The New Zealand Dollar has been outperforming on a perceived monetary policy divergence, this after the ECB, RBA, Fed and BOE all came out leaning on the more accommodative side of policy. Meanwhile, we're seeing added demand after PM Ardern indicated Covid restrictions in Auckland would be progressively eased further. Key standouts on today’s calendar come in the form of German trade, Eurozone and German ZEWs, US producer prices, a Fed Powell speech and a BOE Bailey speech.US SPX 500 – technical overview
Longer-term technical studies are looking quite exhausted and the market is showing signs of wanting to roll over after racing to another record high. At the same time, the latest breakout above 4600 introduces the possibility for the next major upside extension through 4800. At this stage, it will take a break back below 4500 to take the immediate pressure off the topside.US SPX 500 – fundamental overview
We're trading just off fresh record highs, and yet, with so little room for additional central bank accommodation, given an already depressed interest rate environment, the prospect for sustainable runs to the topside on easy money policy incentives and government stimulus, should no longer be as enticing to investors. Meanwhile, ongoing worry associated with coronavirus fallout and risk of rising inflation should weigh more heavily on investor sentiment in Q4 2021.GOLD (SPOT) – technical overview
The 2019 breakout above the 2016 high at 1375 was a significant development, opening the door for fresh record highs and an acceleration beyond the next major psychological barrier at 2000. Setbacks should now be well supported above 1600.GOLD (SPOT) – fundamental overview
The yellow metal continues to be well supported on dips with solid demand from medium and longer-term accounts. These players are more concerned about exhausted monetary policy, extended global equities, and coronavirus fallout. All of this should keep the commodity well supported, with many market participants also fleeing to the hard asset as the grand dichotomy of record high equities and record low yields comes to an unnerving climax.