


Today’s report: What a week for the Buck!
As the week closes out and we take a look back, the most notable development was that US CPI print on Wednesday. Since that release, we’ve seen a repricing of expectations around the Fed outlook – a repricing that has resulted in the US Dollar rallying across the board.
Wake-up call
- Fed-ECB divergence
- More selling
- rate spreads
- Aussie employment
- Oil decline
- Covid costs
- Stocks vulnerable
- Dealers report
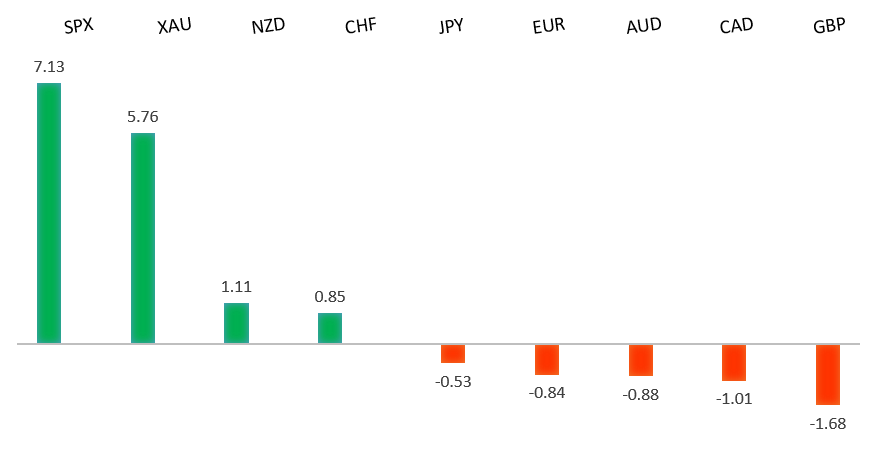
Peformance chart: 30 Day Performance vs. US dollar (%)
Suggested reading
- Really, Truly, Holistically, Stocks are Expensive, J. Authers, Bloomberg (November 12, 2021)
- Can the Vatican Reform its Finances, B. Marino, Financial Times (November 11, 2021)
Chart talk: Technical & fundamental highlights
Choose pair:
EURUSD – technical overview
The market has been looking for a higher low since topping out in 2021 up at 1.2350. Ideally, setbacks continue to be well supported above 1.1400 on a weekly close basis in favour of the next major upside extension back through 1.2350 and towards a retest of the 2018 high at 1.2555 further up. Only a weekly close below 1.1400 would force a rethink.EURUSD – fundamental overview
This week has been all about Fed-ECB policy divergence. The Euro has extended yearly lows against the Buck on the back of dovish ECB rhetoric and US economic data suggesting the Fed will be forced into a less accommodative track. Key standouts on today’s calendar include Eurozone industrial production, US JOLTs job openings, and Michigan sentiment.EURUSD - Technical charts in detail
GBPUSD – technical overview
The market is in a correction phase in the aftermath of the run to fresh multi-month highs earlier this year. At this stage, additional setbacks should be limited to the 1.3200 area ahead of the next major upside extension towards a retest and break of critical resistance in the form of the 2018 high.GBPUSD – fundamental overview
The Pound has been dragged down to a new yearly low against the Buck. Not only is the Pound softer on expectations around the need for the Fed to be less accommodative in light of rising inflation, we've also seen the Pound hit on softer UK data in the form of GDP and industrial production. Key standouts on today’s calendar include Eurozone industrial production, US JOLTs job openings, and Michigan sentiment.USDJPY – technical overview
The longer-term trend is bearish despite the recent run higher. Look for additional upside to be limited, with scope for a topside failure and bearish resumption back down towards the 100.00 area. It would take a clear break back above 114.55 to negate the outlook.USDJPY – fundamental overview
The yield differential gap with the US and a US equities market that has held up into weakness have all been supportive of the US Dollar and bearish Yen. Meanwhile, Japan producer prices have surged to the highest levels since 1981. Key standouts on today’s calendar include Eurozone industrial production, US JOLTs job openings, and Michigan sentiment.AUDUSD – technical overview
The Australian Dollar has been in the process of a healthy consolidation following the impressive run towards a retest of the 2018 high earlier this year. At this stage, there are signs of the market wanting to turn back up and any setbacks should be well supported down into the 0.7200 area. Look for a weekly close above 0.7500 to strengthen the outlook and force a shift in the structure.AUDUSD – fundamental overview
Most of the Aussie weakness this week has come from the US Dollar side of the coin. The market has been repricing Fed expectations, which has driven broad based US Dollar demand. But we've also seen some additional Aussie selling on the back of a discouraging Aussie employment report. Key standouts on today’s calendar include Eurozone industrial production, US JOLTs job openings, and Michigan sentiment.USDCAD – technical overview
Finally signs of a major bottom in the works after a severe decline from the 2020 high. A recent weekly close back above 1.2500 encourages the constructive outlook and opens the door for a push back towards next critical resistance in the 1.3000 area. Any setbacks should be well supported into the 1.2200s.USDCAD – fundamental overview
The Canadian Dollar has come under pressure into the second half of the week, taking a hit from broad based US Dollar demand and a turnaround in the price of oil. Key standouts on today’s calendar include Eurozone industrial production, US JOLTs job openings, and Michigan sentiment.NZDUSD – technical overview
The market has entered a period of consolidation after running up to a yearly and multi-month high. Back above the April high at 0.7317 would be required to force a shift in the structure.NZDUSD – fundamental overview
The New Zealand Dollar has come under pressure into the second half of the week on the back of broad Dollar demand and softer New Zealand data. Meanwhile, Covid and rising input costs are adding more strain. Key standouts on today’s calendar include Eurozone industrial production, US JOLTs job openings, and Michigan sentiment.US SPX 500 – technical overview
Longer-term technical studies are looking quite exhausted and the market is showing signs of wanting to roll over after racing to another record high. At the same time, the latest breakout above 4600 introduces the possibility for the next major upside extension through 4800. At this stage, it will take a break back below 4500 to take the immediate pressure off the topside.US SPX 500 – fundamental overview
We're trading just off fresh record highs, and yet, with so little room for additional central bank accommodation, given an already depressed interest rate environment, the prospect for sustainable runs to the topside on easy money policy incentives and government stimulus, should no longer be as enticing to investors. Meanwhile, ongoing worry associated with coronavirus fallout and risk of rising inflation should weigh more heavily on investor sentiment in Q4 2021.GOLD (SPOT) – technical overview
The 2019 breakout above the 2016 high at 1375 was a significant development, opening the door for fresh record highs and an acceleration beyond the next major psychological barrier at 2000. Setbacks should now be well supported above 1600.GOLD (SPOT) – fundamental overview
The yellow metal continues to be well supported on dips with solid demand from medium and longer-term accounts. These players are more concerned about exhausted monetary policy, extended global equities, and coronavirus fallout. All of this should keep the commodity well supported, with many market participants also fleeing to the hard asset as the grand dichotomy of record high equities and record low yields comes to an unnerving climax.