


Next 24 hours: Volatility around Fed Chair speculation
Today’s report: The disconnect that won't go away
The Dollar has been running higher as US yields move up and US equities have grown a little, just a little more sensitive to the price action in bonds and FX, as they reverse course and head south on the worrying prospect of rising inflation and higher rates.
Wake-up call
- COVID worry
- rising inflation
- sentiment sours
- discouraging wages
- lower oil
- Producer prices
- Stocks vulnerable
- Dealers report
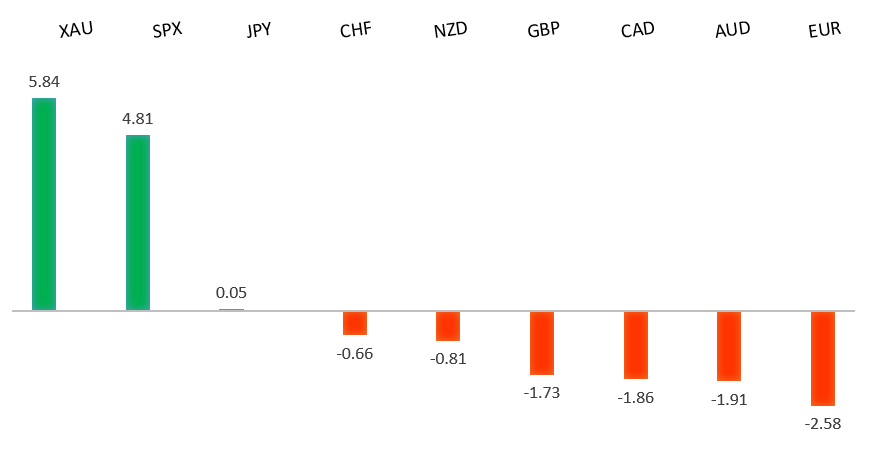
Peformance chart: 30 Day Performance vs. US dollar (%)
Suggested reading
- Crypto's Belief System May Have a Trust Problem, J. Authers, Bloomberg (November 18, 2021)
- Cryptocurrencies: How Regulators Lost Control, D. Garrahan, Financial Times (November 16, 2021)
Chart talk: Technical & fundamental highlights
Choose pair:
EURUSD – technical overview
Setbacks have extended to retest the critical 61.8% fib retrace off the 2020 low to 2021 high move. Technical studies are now tracking in extended territory on the weekly chart, warning of the need for a corrective bounce ahead. Look for the market to hold up on a weekly close basis above the 61.8% fib retrace around 1.1275.EURUSD – fundamental overview
The ECB was out warning of bubbles in property and financial markets in its bi-annual stability report. Leaders in the Euro area were also out warning about the rise in COVID cases, with infection rates at all time highs. On the data front, Eurozone inflation reads came in as expected. Key standouts on today’s calendar come in the form of some Fed and ECB speak, Canada ADP employment, US initial jobless claims, and the Philly Fed.EURUSD - Technical charts in detail
GBPUSD – technical overview
The market is in a correction phase in the aftermath of the run to fresh multi-month highs earlier this year. At this stage, additional setbacks should be limited to the 1.3200 area ahead of the next major upside extension towards a retest and break of critical resistance in the form of the 2018 high.GBPUSD – fundamental overview
The Pound has been outperforming in recent sessions and it's no surprise with inflation rising to its highest levels in the UK since 2011. Meanwhile, BOE Mann was on the wires saying the equilibrium interest rate may have 'upward momentum.' Key standouts on today’s calendar come in the form of some Fed and ECB speak, Canada ADP employment, US initial jobless claims, and the Philly Fed.USDJPY – technical overview
The longer-term trend is bearish despite the recent run higher. Look for additional upside to be limited, with scope for a topside failure and bearish resumption back down towards the 100.00 area. It would take a clear break back above 114.55 to negate the outlook.USDJPY – fundamental overview
Global risk sentiment soured on Wednesday and this resulted in Yen demand. The Yen has also been helped by easing bond yields outside of Japan and a drop in the price of oil. Key standouts on today’s calendar come in the form of some Fed and ECB speak, Canada ADP employment, US initial jobless claims, and the Philly Fed.AUDUSD – technical overview
The Australian Dollar has been in the process of a healthy consolidation following the impressive run towards a retest of the 2018 high earlier this year. At this stage, there are signs of the market wanting to turn back up and any setbacks should be well supported down into the 0.7200 area. Look for a weekly close above 0.7500 to strengthen the outlook and force a shift in the structure.AUDUSD – fundamental overview
The Australian Dollar was under pressure in Wednesday trade, mostly on the back of discouraging wage data and a move south in US equities. Risk sentiment has since picked back up a bit into Thursday, which has supported Aussie on the dip. Key standouts on today’s calendar come in the form of some Fed and ECB speak, Canada ADP employment, US initial jobless claims, and the Philly Fed.USDCAD – technical overview
Finally signs of a major bottom in the works after a severe decline from the 2020 high. A recent weekly close back above 1.2500 encourages the constructive outlook and opens the door for a push back towards next critical resistance in the 1.3000 area. Any setbacks should be well supported into the 1.2200s.USDCAD – fundamental overview
Canada inflation data was steady, home prices ticked down, oil continued to decline and US equities were lower. All of this has factored into the recent underperformance in the Loonie. Key standouts on today’s calendar come in the form of some Fed and ECB speak, Canada ADP employment, US initial jobless claims, and the Philly Fed.NZDUSD – technical overview
The market has entered a period of consolidation after running up to a yearly and multi-month high. Back above the April high at 0.7317 would be required to force a shift in the structure.NZDUSD – fundamental overview
The New Zealand Dollar has held up relatively well in the face of some downside pressure in US equities. We see this reconciled by the fact that New Zealand producer prices have shot up to their highest levels in a decade. Key standouts on today’s calendar come in the form of some Fed and ECB speak, Canada ADP employment, US initial jobless claims, and the Philly Fed.US SPX 500 – technical overview
Longer-term technical studies are looking quite exhausted and the market is showing signs of wanting to roll over after racing to another record high. At the same time, the latest breakout above 4600 introduces the possibility for the next major upside extension through 4800. At this stage, it will take a break back below 4500 to take the immediate pressure off the topside.US SPX 500 – fundamental overview
We're trading just off fresh record highs, and yet, with so little room for additional central bank accommodation, given an already depressed interest rate environment, the prospect for sustainable runs to the topside on easy money policy incentives and government stimulus, should no longer be as enticing to investors. Meanwhile, ongoing worry associated with coronavirus fallout and risk of rising inflation should weigh more heavily on investor sentiment in Q4 2021.GOLD (SPOT) – technical overview
The 2019 breakout above the 2016 high at 1375 was a significant development, opening the door for fresh record highs and an acceleration beyond the next major psychological barrier at 2000. Setbacks should now be well supported above 1600.GOLD (SPOT) – fundamental overview
The yellow metal continues to be well supported on dips with solid demand from medium and longer-term accounts. These players are more concerned about exhausted monetary policy, extended global equities, and coronavirus fallout. All of this should keep the commodity well supported, with many market participants also fleeing to the hard asset as the grand dichotomy of record high equities and record low yields comes to an unnerving climax.