


Today’s report: Thanksgiving is here
Trading conditions will be exceptionally thin for the remainder of the week on account of the US Thanksgiving holiday break. As we head into the break, the US Dollar is bid across the board on the back of bets the Fed will be shifting more towards the hawkish side in the months ahead.
Wake-up call
- German GDP
- UK CBI
- Yield differentials
- Healthy PMIs
- Oil recovery
- RBNZ Orr
- Stocks vulnerable
- Dealers report
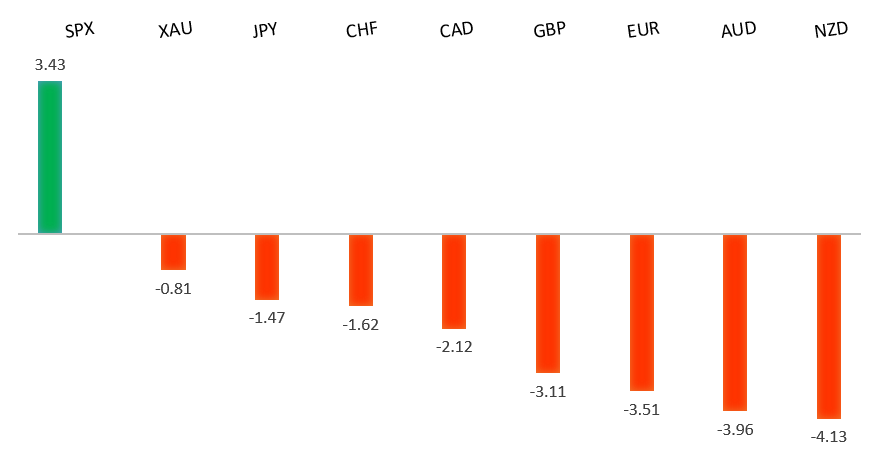
Peformance chart: 30 Day Performance vs. US dollar (%)
Suggested reading
- Jamie Dimon's Other Comment About China Was No Joke, T. Culpan, Bloomberg (November 24, 2021)
- How Space-Based Solar Power Can Save the Planet, P. Hollinger, Financial Times (November 24, 2021)
Chart talk: Technical & fundamental highlights
Choose pair:
EURUSD – technical overview
Setbacks have extended to retest the critical 61.8% fib retrace off the 2020 low to 2021 high move. Technical studies are now tracking in extended territory on the weekly chart, warning of the need for a corrective bounce ahead. Look for the market to hold up on a weekly close basis above the 61.8% fib retrace around 1.1275.EURUSD – fundamental overview
Yield differentials and a worsening COVID situation in Europe continue to weigh on the Euro to fresh yearly and multi-month lows. Trading conditions will be exceptionally thin for the remainder of the week on account of the US Thanksgiving holiday break. Key standouts on today’s calendar come in the form of German GfK consumer confidence, German GDP, some ECB speak, UK distributive trades, and BOE speak.EURUSD - Technical charts in detail
GBPUSD – technical overview
The market is in a correction phase in the aftermath of the run to fresh multi-month highs earlier this year. At this stage, additional setbacks should be limited to the 1.3200 area ahead of the next major upside extension towards a retest and break of critical resistance in the form of the 2018 high.GBPUSD – fundamental overview
The Pound has been under pressure on yield differentials with the US Dollar, though we have seen some relative outperformance thanks to a solid UK CBI survey. Key standouts on today’s calendar come in the form of German GfK consumer confidence, German GDP, some ECB speak, UK distributive trades, and BOE speak.USDJPY – technical overview
The longer-term trend is bearish despite the recent run higher. Look for additional upside to be limited, with scope for a topside failure and bearish resumption back down towards the 100.00 area. It would take a clear break back above 116.00 to negate the outlook.USDJPY – fundamental overview
The Yen has extended yearly lows against the Buck this week. Yield differentials are clearly having a bigger impact after the market priced in a more hawkish Fed path on the Powell reappointment. Trading conditions will be exceptionally thin for the remainder of the week on account of the US Thanksgiving holiday break. Key standouts on today’s calendar come in the form of German GfK consumer confidence, German GDP, some ECB speak, UK distributive trades, and BOE speak.AUDUSD – technical overview
The Australian Dollar has been in the process of a healthy consolidation following the impressive run towards a retest of the 2018 high earlier this year. At this stage, there are signs of the market wanting to turn back up and any setbacks should be well supported down into the 0.7200 area. Look for a weekly close above 0.7500 to strengthen the outlook and force a shift in the structure.AUDUSD – fundamental overview
A round of healthy Aussie PMI readings and another well supported dip in US equities have been behind the latest recovery in the Australian Dollar. Trading conditions will be exceptionally thin for the remainder of the week on account of the US Thanksgiving holiday break. Key standouts on today’s calendar come in the form of German GfK consumer confidence, German GDP, some ECB speak, UK distributive trades, and BOE speak.USDCAD – technical overview
Finally signs of a major bottom in the works after a severe decline from the 2020 high. A recent weekly close back above 1.2500 encourages the constructive outlook and opens the door for a push back towards next critical resistance in the 1.3000 area. Any setbacks should be well supported into the 1.2200s.USDCAD – fundamental overview
Canada factory sales came in well above expectation earlier this week, oil has recovered quite a bit and US equities were supported on dips yet again. All of this has been behind this latest run of outperformance in the Canadian Dollar despite broad based US Dollar demand on more hawkish Fed expectations. Trading conditions will be exceptionally thin for the remainder of the week on account of the US Thanksgiving holiday break. Key standouts on today’s calendar come in the form of German GfK consumer confidence, German GDP, some ECB speak, UK distributive trades, and BOE speak.NZDUSD – technical overview
The market has entered a period of consolidation after running up to a yearly and multi-month high. Back below 0.6800 would be required to force a shift in the structure.NZDUSD – fundamental overview
The New Zealand Dollar is underperforming this week on the back of a very discouraging retail sales print and comments from RBNZ Orr that heavy household debt is a reason for concern. All of this has the market reconsidering hawkish RBNZ bets. Trading conditions will be exceptionally thin for the remainder of the week on account of the US Thanksgiving holiday break. Key standouts on today’s calendar come in the form of German GfK consumer confidence, German GDP, some ECB speak, UK distributive trades, and BOE speak.US SPX 500 – technical overview
Longer-term technical studies are looking quite exhausted and the market is showing signs of wanting to roll over after racing to another record high. At the same time, the latest breakout above 4600 introduces the possibility for the next major upside extension through 4800. At this stage, it will take a break back below 4500 to take the immediate pressure off the topside.US SPX 500 – fundamental overview
We're trading just off fresh record highs, and yet, with so little room for additional central bank accommodation, given an already depressed interest rate environment, the prospect for sustainable runs to the topside on easy money policy incentives and government stimulus, should no longer be as enticing to investors. Meanwhile, ongoing worry associated with coronavirus fallout and risk of rising inflation should weigh more heavily on investor sentiment in Q4 2021.GOLD (SPOT) – technical overview
The 2019 breakout above the 2016 high at 1375 was a significant development, opening the door for fresh record highs and an acceleration beyond the next major psychological barrier at 2000. Setbacks should now be well supported above 1600.GOLD (SPOT) – fundamental overview
The yellow metal continues to be well supported on dips with solid demand from medium and longer-term accounts. These players are more concerned about exhausted monetary policy, extended global equities, and coronavirus fallout. All of this should keep the commodity well supported, with many market participants also fleeing to the hard asset as the grand dichotomy of record high equities and record low yields comes to an unnerving climax.