


Next 24 hours: It's all about US equities
Today’s report: Dollar selling not expected to last
It seems the softer US NFP print this past Friday was behind a lot of the move lower in the US Dollar, but we thought the market was focusing on the wrong data point and that the Dollar sell off would be short-lived. And indeed, into Monday, the Buck is already making its way back.
Wake-up call
- record inflation
- US Dollar
- appetite recedes
- growth forecast
- jobs numbers
- Sentiment deterioration
- Stocks vulnerable
- Dealers report
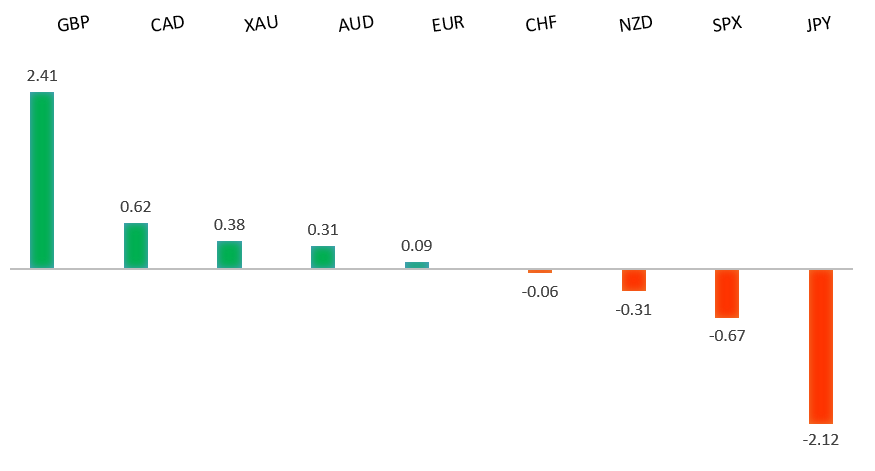
Peformance chart: 30 Day Performance vs. US dollar (%)
Suggested reading
- Up Next on Treasury Yields, It’s the Red Sox or Godot, J. Authers, Bloomberg (January 10, 2022)
- This Is How Bull Markets End, G. Diamond, American Consequences (January 7, 2022)
Chart talk: Technical & fundamental highlights
Choose pair:
EURUSD – technical overview
Setbacks have extended to retest the critical 61.8% fib retrace off the 2020 low to 2021 high move. Technical studies are now tracking in extended territory on the weekly chart, warning of the need for a corrective bounce ahead. Look for the market to hold up on a weekly close basis above the 61.8% fib retrace around 1.1275. Back above 1.1465 strengthens outlook. Weekly close below 1.1275 negates.EURUSD – fundamental overview
The big story for the Euro into Monday is the latest Euro area CPI data, which printed a record high 5%. This resulted in some demand for the single currency, though ultimately, the Euro remains well capped into rallies on monetary policy divergence and offsetting elevated inflation in the US. Looking ahead, Monday’s calendar is quite light, with only Eurozone unemployment and US consumer inflation expectations standing out.EURUSD - Technical charts in detail
GBPUSD – technical overview
The market is in a correction phase in the aftermath of the run to fresh multi-month highs earlier this year. At this stage, additional setbacks should be limited to the 1.3000 area ahead of the next major upside extension towards a retest and break of critical resistance in the form of the 2018 high. Back above 1.3608 takes pressure off the downside.GBPUSD – fundamental overview
UK construction PMIs came in soft on Friday, but this didn't do anything to weigh on the Pound, with the currency bid on the back of broad based US Dollar selling. Looking ahead, Monday’s calendar is quite light, with only Eurozone unemployment and US consumer inflation expectations standing out.USDJPY – technical overview
The longer-term trend is bearish despite the recent run higher. Look for additional upside to be limited, with scope for a topside failure and bearish resumption back down towards the 100.00 area. It would take a clear break back above 116.00 to negate the outlook.USDJPY – fundamental overview
The Yen has been well offered into 2022 on flow from US Dollar demand on diverging Fed/BOJ policy. But last week's round of intense risk off flow in US equities could not be ignored, with the Yen finding demand on the traditional correlation. Looking ahead, Monday’s calendar is quite light, with only Eurozone unemployment and US consumer inflation expectations standing out.AUDUSD – technical overview
The Australian Dollar has been in the process of a healthy correction following the impressive run towards a retest of the 2018 high in 2021. At this stage, the correction is starting to look stretched and setbacks should be well supported above 0.7000 on a weekly close basis. A weekly close below 0.7000 will force a bearish shift.AUDUSD – fundamental overview
Overall, the Australian Dollar is under pressure, mostly on the back of diverging Fed/RBA policy and this latest dump in US equities. Meanwhile, rising COVID infections and hospitalizations have forced many states to reinstitute restrictions. The ANZ weekly dining/retail/travel spending tracker has fallen to the lowest level since 2021 lockdown began. Nomura has come out cutting Australia's Q1 growth forecast to 0% from 1.4% previous. Looking ahead, Monday’s calendar is quite light, with only Eurozone unemployment and US consumer inflation expectations standing out.USDCAD – technical overview
Finally signs of a major bottom in the works after a severe decline from the 2020 high. A recent weekly close back above 1.2500 encourages the constructive outlook and opens the door for a push back towards next critical resistance in the 1.3000 area. Any setbacks should be well supported into the 1.2200s.USDCAD – fundamental overview
Overall, the Canadian Dollar is under pressure into 2022, falling victim to diverging central bank policy, a worsening virus outlook in Canada and broad based risk off flow. We did however see some demand on Friday despite a crashing Canada Ivey PMI number, with solid Canada employment and broad based US Dollar outflows factoring into the price action. Looking ahead, Monday’s calendar is quite light, with only Eurozone unemployment and US consumer inflation expectations standing out.NZDUSD – technical overview
The market has entered a period of intense correction after running up to a yearly and multi-month high. Back below 0.6700 would suggest a more significant bearish structural shift.NZDUSD – fundamental overview
Overall, economic data out of New Zealand has been softer of late, RBNZ rate hike expectations have been scaled back, the phased border reopening has been delayed due to omicron, and risk off flow has soured sentiment. All of this has been behind this latest wave of Kiwi underperformance into 2022. Looking ahead, Monday’s calendar is quite light, with only Eurozone unemployment and US consumer inflation expectations standing out.US SPX 500 – technical overview
Longer-term technical studies are looking quite exhausted and the market is showing signs of wanting to roll over after racing to another record high. At the same time, the latest breakout into the 4800 area introduces the possibility for the next major upside extension towards 5000. At this stage, it will take a break back below 4500 to take the immediate pressure off the topside.US SPX 500 – fundamental overview
We're trading just off fresh record highs, and yet, with so little room for additional central bank accommodation, given an already depressed interest rate environment, the prospect for sustainable runs to the topside on easy money policy incentives and government stimulus, should no longer be as enticing to investors. Meanwhile, ongoing worry associated with coronavirus fallout and risk of rising inflation should weigh more heavily on investor sentiment in Q1 2022.GOLD (SPOT) – technical overview
The 2019 breakout above the 2016 high at 1375 was a significant development, opening the door for fresh record highs and an acceleration beyond the next major psychological barrier at 2000. Setbacks should now be well supported above 1600.GOLD (SPOT) – fundamental overview
The yellow metal continues to be well supported on dips with solid demand from medium and longer-term accounts. These players are more concerned about exhausted monetary policy, extended global equities, and coronavirus fallout. All of this should keep the commodity well supported, with many market participants also fleeing to the hard asset as the grand dichotomy of record high equities and record low yields comes to an unnerving climax.