


Next 24 hours: Hard to beat
Today’s report: Powell sends a different message
We’re looking at risk on flow into Wednesday and a lot of that has to do with Jerome Powell’s latest remarks. At the central banker’s re-confirmation hearing on Tuesday he was sounding decidedly less hawkish than what the market has been pricing.
Wake-up call
- ECB Lane
- BOE expectations
- inflation forecast
- strong data
- rallying oil
- USD selling
- Stocks vulnerable
- Dealers report
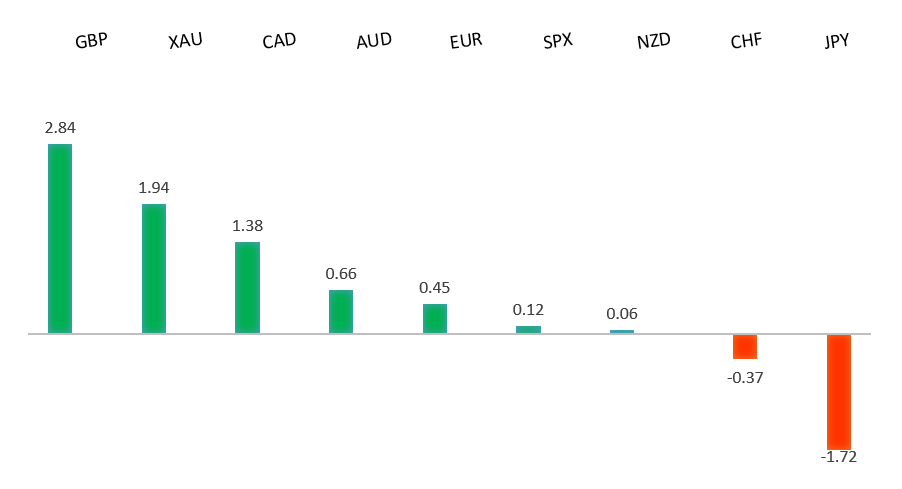
Peformance chart: 30 Day Performance vs. US dollar (%)
Suggested reading
- The Psychology of 7% Is Hiding Other Inflation Data, J. Authers, Bloomberg (January 12, 2022)
- Markets are Signaling Growth & Rejecting Inflation, J. Calhoun, Alhambra (January 10, 2022)
Chart talk: Technical & fundamental highlights
Choose pair:
EURUSD – technical overview
Setbacks have extended to retest the critical 61.8% fib retrace off the 2020 low to 2021 high move. Technical studies are now tracking in extended territory on the weekly chart, warning of the need for a corrective bounce ahead. Look for the market to hold up on a weekly close basis above the 61.8% fib retrace around 1.1275. Back above 1.1465 strengthens outlook. Weekly close below 1.1275 negates.EURUSD – fundamental overview
The Euro has mostly edged higher on broad US Dollar selling, though selling persists with the ECB stuck on the sidelines. ECB Lane has said a 2022 rate hike is unlikely. Key standouts on today’s calendar come in the form of German wholesale prices, Eurozone industrial production, and US inflation.EURUSD - Technical charts in detail
GBPUSD – technical overview
The market is in a correction phase in the aftermath of the run to fresh multi-month highs in 2021. At this stage, additional setbacks should be limited to the 1.3000 area ahead of the next major upside extension towards a retest and break of critical resistance in the form of the 2018 high. Back above 1.3835 takes pressure off the downside.GBPUSD – fundamental overview
The Pound retains a bid tone into Wednesday on the back of February BOE rate hike expectations. The Pound has benefitted greatly from this latest bout of broad based selling in the US Dollar. Key standouts on today’s calendar come in the form of German wholesale prices, Eurozone industrial production, and US inflation.USDJPY – technical overview
The longer-term trend is bearish despite the recent run higher. Look for additional upside to be limited, with scope for a topside failure and bearish resumption back down towards the 100.00 area. It would take a clear break back above 116.00 to negate the outlook.USDJPY – fundamental overview
The Yen has been well offered into 2022 on flow from US Dollar demand on diverging Fed/BOJ policy. But the recent round of intense risk off flow in US equities could not be ignored, with the Yen finding demand on the traditional correlation. Meanwhile, the BOJ is said to be considering upping its inflation forecast. Key standouts on today’s calendar come in the form of German wholesale prices, Eurozone industrial production, and US inflation.AUDUSD – technical overview
The Australian Dollar has been in the process of a healthy correction following the impressive run towards a retest of the 2018 high in 2021. At this stage, the correction is starting to look stretched and setbacks should be well supported above 0.7000 on a weekly close basis. A weekly close below 0.7000 will force a bearish shift.AUDUSD – fundamental overview
We've seen some demand in recent sessions as stocks recover, Aussie data comes in strong and commodities prices jump. Key standouts on today’s calendar come in the form of German wholesale prices, Eurozone industrial production, and US inflation.USDCAD – technical overview
Finally signs of a major bottom in the works after a severe decline from the 2020 high. A recent weekly close back above 1.2500 encourages the constructive outlook and opens the door for a push back towards next critical resistance in the 1.3000 area. Any setbacks should be well supported into the 1.2200s.USDCAD – fundamental overview
Oil has made an impressive run higher, while US equities are doing the same. Both of these markets are helping to drive this latest run of outperformance in the Canadian Dollar. Key standouts on today’s calendar come in the form of German wholesale prices, Eurozone industrial production, and US inflation.NZDUSD – technical overview
The market has entered a period of intense correction after running up to a yearly and multi-month high. Back below 0.6700 would suggest a more significant bearish structural shift.NZDUSD – fundamental overview
Overall, economic data out of New Zealand has been softer of late, RBNZ rate hike expectations have been scaled back, the phased border reopening has been delayed due to omicron, and risk off flow has soured sentiment. All of this has been behind this latest wave of Kiwi underperformance into 2022. We have however seen some mild demand on account of broad based US Dollar selling. Key standouts on today’s calendar come in the form of German wholesale prices, Eurozone industrial production, and US inflation.US SPX 500 – technical overview
Longer-term technical studies are looking quite exhausted and the market is showing signs of wanting to roll over after racing to another record high. At the same time, the latest breakout into the 4800 area introduces the possibility for the next major upside extension towards 5000. At this stage, it will take a break back below 4500 to take the immediate pressure off the topside.US SPX 500 – fundamental overview
We're trading just off fresh record highs, and yet, with so little room for additional central bank accommodation, given an already depressed interest rate environment, the prospect for sustainable runs to the topside on easy money policy incentives and government stimulus, should no longer be as enticing to investors. Meanwhile, ongoing worry associated with coronavirus fallout and risk of rising inflation should weigh more heavily on investor sentiment in Q1 2022.GOLD (SPOT) – technical overview
The 2019 breakout above the 2016 high at 1375 was a significant development, opening the door for fresh record highs and an acceleration beyond the next major psychological barrier at 2000. Setbacks should now be well supported above 1600.GOLD (SPOT) – fundamental overview
The yellow metal continues to be well supported on dips with solid demand from medium and longer-term accounts. These players are more concerned about exhausted monetary policy, extended global equities, and coronavirus fallout. All of this should keep the commodity well supported, with many market participants also fleeing to the hard asset as the grand dichotomy of record high equities and record low yields comes to an unnerving climax.