


Today’s report: The game is changing and it ain't pretty
The slide in US equities has continued into Friday, with the S&P 500 trading back to its lowest levels since October. What’s concerning about it all is that gestures which have normally done a good job propping sentiment just aren’t doing the trick.
Wake-up call
- ECB dismisses
- virus restrictions
- export data
- Aussie slides
- retail sales
- PMI reads
- Stocks vulnerable
- Dealers report
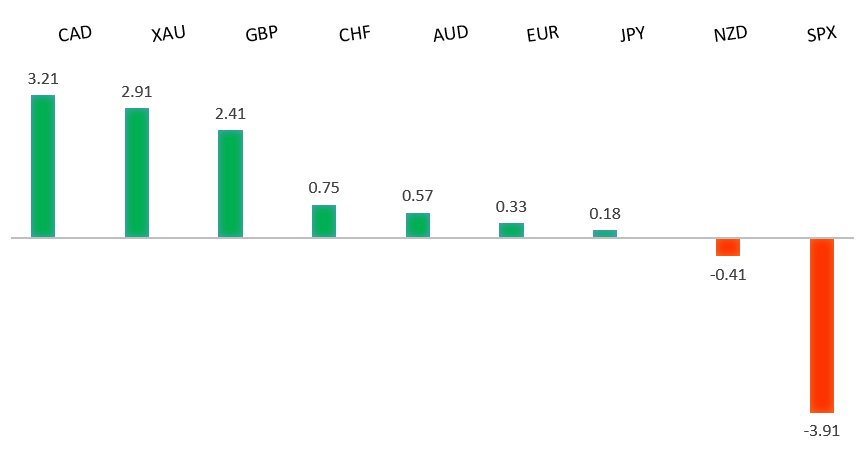
Peformance chart: 30 Day Performance vs. US dollar (%)
Suggested reading
- Whatever a Correction Really Is, This Isn’t Yet, J. Authers, Bloomberg (January 21, 2022)
- Sports NFTs: collectors, players and leagues cash in on the action, S. Germano, FT (January 20, 2022)
Chart talk: Technical & fundamental highlights
Choose pair:
EURUSD – technical overview
Setbacks have extended to retest the critical 61.8% fib retrace off the 2020 low to 2021 high move. Technical studies are now turning up from extended territory on the weekly chart, warning of the need for an additional corrective bounce ahead. Look for the market to hold up on a weekly close basis above the 61.8% fib retrace around 1.1275. Weekly close back above 1.1500 strengthens outlook. Weekly close below 1.1275 negates.EURUSD – fundamental overview
The Euro continues to be well capped into rallies despite record inflation, given the ECB's ongoing dismissal of the data. Meanwhile, Ukraine tension has also been capping Euro upside. Key standouts on today’s calendar come from UK retail sales, an ECB Lagarde speech, Canada retail sales, and Eurozone consumer confidence.EURUSD - Technical charts in detail
GBPUSD – technical overview
The market is in a correction phase in the aftermath of the run to fresh multi-month highs in 2021. At this stage, additional setbacks should be limited to the 1.3000 area ahead of the next major upside extension towards a retest and break of critical resistance in the form of the 2018 high. Back above 1.3835 takes pressure off the downside.GBPUSD – fundamental overview
The Pound has been outperforming this week, getting help from the BOE-ECB policy divergence and this latest hot UK CPI print which produced a new high of 5.4%. The core rate was also elevated, at its highest level since 1992. Meanwhile, PM Johnson has announced an end to Plan B virus curbs on January 27th, yet another prop for the Pound. Key standouts on today’s calendar come from UK retail sales, an ECB Lagarde speech, Canada retail sales, and Eurozone consumer confidence.USDJPY – technical overview
The longer-term trend is bearish despite the recent run higher. Look for additional upside to be limited, with scope for a topside failure and bearish resumption back down towards the 100.00 area. It would take a clear break back above 116.00 to negate the outlook.USDJPY – fundamental overview
A recent round of intense risk off flow in US equities and a healthy Japanese export data showing have contributed to the latest round of Yen demand. Key standouts on today’s calendar come from UK retail sales, an ECB Lagarde speech, Canada retail sales, and Eurozone consumer confidence.AUDUSD – technical overview
The Australian Dollar has been in the process of a healthy correction following the impressive run towards a retest of the 2018 high in 2021. At this stage, the correction is starting to look stretched and setbacks should be well supported above 0.7000 on a weekly close basis. A weekly close below 0.7000 will force a bearish shift.AUDUSD – fundamental overview
The Australian Dollar has already given back gains from Thursday's strong jobs report and upgrades to RBA rate hike calls. This latest round of intense risk off flow has more than offset. Key standouts on today’s calendar come from UK retail sales, an ECB Lagarde speech, Canada retail sales, and Eurozone consumer confidence.USDCAD – technical overview
Finally signs of a major bottom in the works after a severe decline from the 2020 high. A recent weekly close back above 1.2500 encourages the constructive outlook and opens the door for a push back towards next critical resistance in the 1.3000 area. Any setbacks should be well supported into the 1.2200s.USDCAD – fundamental overview
Plenty of positives for the Canadian Dollar this week, with oil well supported, Canada inflation running hot, and Ontario announcing an easing of COVID restrictions. At the same time, it's been hard to ignore the risk off flow into the end of the week, which has resulted in some downside pressure on the Loonie. Key standouts on today’s calendar come from UK retail sales, an ECB Lagarde speech, Canada retail sales, and Eurozone consumer confidence.NZDUSD – technical overview
The market has entered a period of intense correction after running up to a yearly and multi-month high. Back below 0.6700 would suggest a more significant bearish structural shift.NZDUSD – fundamental overview
The New Zealand Dollar has been dragged lower this week on risk off flow and after a number of Omicron cases were detected. Friday economic data out of New Zealand was solid but hasn't factored into price action. Key standouts on today’s calendar come from UK retail sales, an ECB Lagarde speech, Canada retail sales, and Eurozone consumer confidence.US SPX 500 – technical overview
Longer-term technical studies are in the process of unwinding from extended readings off record highs. The latest breakdown below 4,500 opens the door for the next major downside extension towards the October 2021 low at 4,272. Back above 4,612 will be required at a minimum to take the immediate pressure off the downside.US SPX 500 – fundamental overview
We're trading just off fresh record highs, and yet, with so little room for additional central bank accommodation, given an already depressed interest rate environment, the prospect for sustainable runs to the topside on easy money policy incentives and government stimulus, should no longer be as enticing to investors. Meanwhile, ongoing worry associated with coronavirus fallout and risk of rising inflation should weigh more heavily on investor sentiment in Q1 2022.GOLD (SPOT) – technical overview
The 2019 breakout above the 2016 high at 1375 was a significant development, opening the door for fresh record highs and an acceleration beyond the next major psychological barrier at 2000. Setbacks should now be well supported above 1600.GOLD (SPOT) – fundamental overview
The yellow metal continues to be well supported on dips with solid demand from medium and longer-term accounts. These players are more concerned about exhausted monetary policy, extended global equities, and coronavirus fallout. All of this should keep the commodity well supported, with many market participants also fleeing to the hard asset as the grand dichotomy of record high equities and record low yields comes to an unnerving climax.