


Special report: FOMC policy decision preview
Today’s report: Positioning into the event risk
It’s become quite clear that the market really doesn’t want to be making any major decisions about the next big moves until today’s Fed event risk is out of the way. Trading activity has been rather dull this week thus far and we would mostly describe it as position adjusting into the Fed decision.
Wake-up call
- monster PPI
- manufacturing PMIs
- Golden Week
- retail sales
- trade data
- Dairy prices
- Stocks vulnerable
- Dealers report
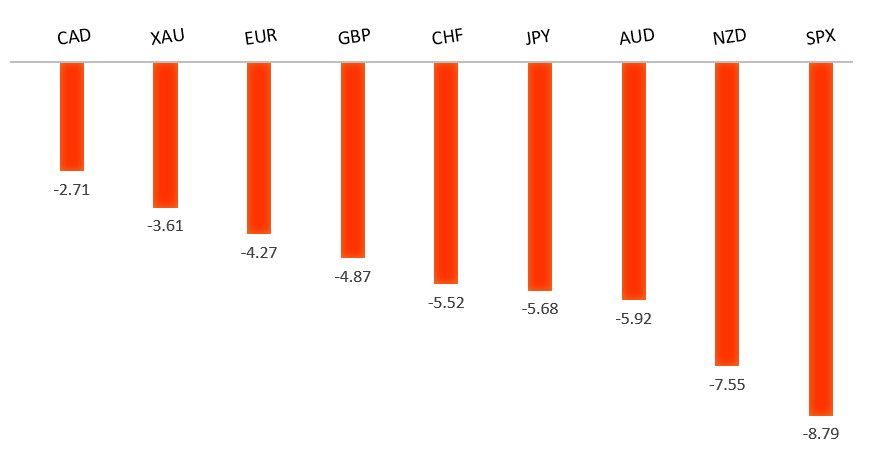
Peformance chart: 30 Day Performance vs. US dollar (%)
Suggested reading
- Don't Fret for Hong Kong's Dollar Peg Just Yet, M. Brooker, Bloomberg (May 4, 2022)
- Highlights from the FT's Crypto and Digital Assets Summit, Financial Times (May 4, 2022)
Chart talk: Technical & fundamental highlights
Choose pair:
EURUSD – technical overview
A recent breakdown below 1.1100 to fresh multi-month lows now sets up the next major downside extension towards the multi-year low from 2017 in the 1.0300 area. At this stage, it will take a push back above 1.1500 to force a shift in the outlook.EURUSD – fundamental overview
The Euro hasn't managed to rally much in recent sessions, though the single currency did get some help on the back of a monster Eurozone producer prices reading and comments from ECB Schnabel who said it's time for the ECB to start taming inflation, and that a rate hike may come as early as July. Key standouts on today’s calendar come from German trade, German and Eurozone PMI reads, Eurozone retail sales, US ADP employment, Canada trade, US trade, US ISM non-manufacturing, and the FOMC policy decision.EURUSD - Technical charts in detail
GBPUSD – technical overview
The market is in a correction phase in the aftermath of the run to fresh multi-month highs in 2021. At this stage, additional setbacks should be limited to the 1.2500 area ahead of the next major upside extension towards a retest and break of critical resistance in the form of the 2018 high. Back above 1.3148 takes immediate pressure off the downside.GBPUSD – fundamental overview
The Pound is trying to find some strength after getting hit hard, mostly on the back of favorable US Dollar yield differentials. On Tuesday, we saw some demand work its way in, perhaps helped along by a solid UK manufacturing PMI print. Key standouts on today’s calendar come from German trade, German and Eurozone PMI reads, Eurozone retail sales, US ADP employment, Canada trade, US trade, US ISM non-manufacturing, and the FOMC policy decision.USDJPY – technical overview
The market has rocketed higher to its highest levels since 2002 after breaking through the 2015 high. Technical studies are however quite extended, with scope for a sizable correction in the weeks ahead. Look for additional upside from here to be limited to the 130.00 area for now.USDJPY – fundamental overview
The arrival of the Golden Week holiday has tempered activity, with the Yen less under pressure than it has been. Still, overall, the Yen remains weighed down on a major monetary policy divergence between the Fed and BOJ. Key standouts on today’s calendar come from German trade, German and Eurozone PMI reads, Eurozone retail sales, US ADP employment, Canada trade, US trade, US ISM non-manufacturing, and the FOMC policy decision.AUDUSD – technical overview
At this stage, the market has found a bottom and is trying to hold up into dips. Still, the overall pressure remains on the downside and ultimately, it will take a weekly close back above 0.7600 to officially shift the focus back on the topside.AUDUSD – fundamental overview
The Australian Dollar is benefitting from good news into Wednesday, with the currency rallying in the aftermath of an impressive Aussie retail sales print and an easing of COVID restrictions across Australia. Key standouts on today’s calendar come from German trade, German and Eurozone PMI reads, Eurozone retail sales, US ADP employment, Canada trade, US trade, US ISM non-manufacturing, and the FOMC policy decision.USDCAD – technical overview
Signs of a major bottom in the works after a severe decline from the 2020 high. A recent weekly close back above 1.2500 encourages the constructive outlook and opens the door for a push back towards next critical resistance in the 1.3000 area. Any setbacks should be well supported into the 1.2200s.USDCAD – fundamental overview
This Canadian Dollar has managed to recover a bit, with the currency perhaps getting some help from profit taking on US Dollar longs into today's Fed event risk. A broad rally in commodities prices could also be helping the Loonie. Key standouts on today’s calendar come from German trade, German and Eurozone PMI reads, Eurozone retail sales, US ADP employment, Canada trade, US trade, US ISM non-manufacturing, and the FOMC policy decision.NZDUSD – technical overview
The market has been trending lower since topping out in 2021, making a series of lower highs and lower lows. Look for the latest recovery rally to set up the next lower top for a bearish continuation below 0.6500 and towards 0.6000. Back above 0.7200 would be required to negate and force a shift in the structure.NZDUSD – fundamental overview
The New Zealand Dollar is struggling mightily with risk off flow, softer local data, and resulting rate hike expectations which have cooled off. Into Wednesday, we've seen New Zealand commodity export prices decline, and a drop in dairy prices on lower Chinese demand. Key standouts on today’s calendar come from German trade, German and Eurozone PMI reads, Eurozone retail sales, US ADP employment, Canada trade, US trade, US ISM non-manufacturing, and the FOMC policy decision.US SPX 500 – technical overview
Longer-term technical studies are in the process of unwinding from extended readings off record highs. Look for rallies to be well capped in favor of lower tops and lower lows. Back above 4,312 will be required at a minimum to take the immediate pressure off the downside. Below 4000 opens next downside extension.US SPX 500 – fundamental overview
With so little room for additional central bank accommodation, given an already depressed interest rate environment, the prospect for sustainable runs to the topside on easy money policy incentives and government stimulus, should no longer be as enticing to investors. Meanwhile, ongoing worry associated with coronavirus fallout, rising inflation, and geopolitical tension should weigh more heavily on investor sentiment in Q2 2022.GOLD (SPOT) – technical overview
The 2019 breakout above the 2016 high at 1375 was a significant development, opening the door for fresh record highs. Setbacks should now be well supported above 1800.GOLD (SPOT) – fundamental overview
The yellow metal continues to be well supported on dips with solid demand from medium and longer-term accounts. These players are more concerned about exhausted monetary policy, extended global equities, coronavirus fallout, inflation risk, and geopolitical tension. All of this should keep the commodity well supported, with many market participants also fleeing to the hard asset as the grand dichotomy of record high equities and record low yields comes to an unnerving climax.