


Today’s report: A different kind of 'Don't Fight the Fed'
For many years, it was all about ‘don’t fight the Fed’ with respect to betting against additional monetary policy accommodation. These days, that mantra is still going strong, except for the fact that now, it’s all about ‘don’t fight the Fed’ with respect to betting against monetary policy normalization.
Wake-up call
- energy leverage
- Miserable batch
- traditional correlation
- reflation trade
- buy-stops triggered
- risk liquidation
- Stocks vulnerable
- Dealers report
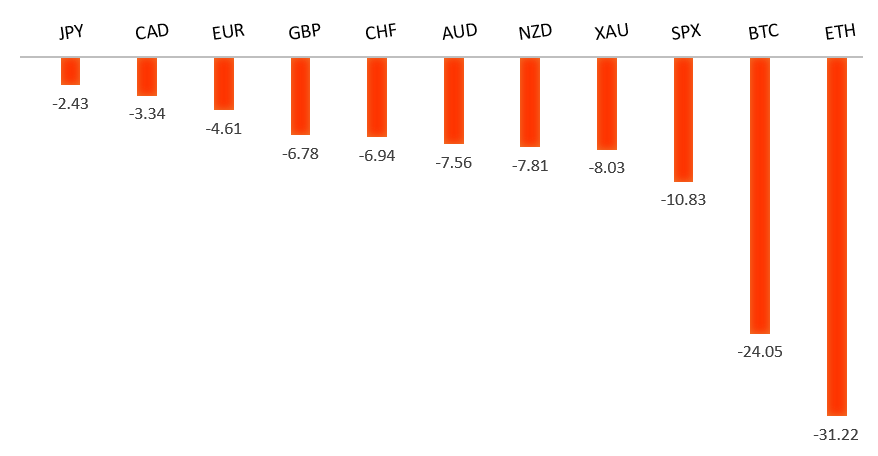
Peformance chart: 30 Day Performance vs. US dollar (%)
Suggested reading
- Tesla Is Hedging Its Global Supply Chain Bets, A. Trivedi, Bloomberg (May 12, 2022)
- Musk Talks to the FT about Twitter, Tesla and Trump, P. Campbell, Financial Times (May 11, 2022)
Chart talk: Technical & fundamental highlights
Choose pair:
EURUSD – technical overview
The market has come under intense pressure in recent weeks, with setbacks accelerating to retest the multi-year low from 2017. A clear break below 1.0300 now sets up the next downside extension towards parity. At the same time, technical studies are looking rather oversold and warn of a bounce over the coming sessions. Back above 1.0650 would be required at a minimum to take the immediate pressure off the downside.EURUSD – fundamental overview
The Euro has seen added downside pressure towards the 2017 low as Russia ups its energy leverage over Europe. Germany's Habeck has responded saying Russia is weaponizing energy. Key standouts on today’s calendar come in the form of an ECB Guindos speech, Eurozone industrial production, US import prices, Michigan sentiment, a Fed Kashkari speech, and an ECB Schnabel speech.EURUSD - Technical charts in detail
GBPUSD – technical overview
The recent drop below 1.2500 has accelerated declines, with the market firmly focused on next key support in the form of the 2019 low around 1.1960. However, if indeed we do see a test of this level over the coming days, additional setbacks should be very well supported with technical studies highly extended and a bullish reversal anticipated. Back above 1.2640 will be required to take the immediate pressure off the downside.GBPUSD – fundamental overview
The Pound is getting no help from UK data, with the latest batch of GDP, industrial production and manufacturing production all disappointing. The only silver lining for the Pound have been hawkish comments from BOE Ramsden after calling for more rate hikes. Key standouts on today’s calendar come in the form of an ECB Guindos speech, Eurozone industrial production, US import prices, Michigan sentiment, a Fed Kashkari speech, and an ECB Schnabel speech.USDJPY – technical overview
The market has rocketed higher to its highest levels since 2002 after breaking through the 2015 high. Technical studies are however in the process of unwinding from overbought readings, with scope for a sizable correction in the weeks ahead. Look for additional upside from here to be limited to the 130.00 area for now. A break back below 127.00 would confirm the likelihood of a deeper pullback.USDJPY – fundamental overview
We are finally seeing evidence of a Yen that has perhaps fallen a little too hard and fast on monetary policy divergence between the BOJ and Fed. Instead, recent price action suggests the Yen is still in demand on the back of traditional correlations with risk off flow. Key standouts on today’s calendar come in the form of an ECB Guindos speech, Eurozone industrial production, US import prices, Michigan sentiment, a Fed Kashkari speech, and an ECB Schnabel speech.AUDUSD – technical overview
The market has dropped back to a critical internal support level in the form of the 2016 low. A breakdown below this level would open the door for a bearish continuation towards 0.6000. Back above 0.7265 would be required to take the immediate pressure off the downside.AUDUSD – fundamental overview
The reflation trade is clearly having a massive negative impact on the Australian Dollar, with the currency sinking to another yearly low, while also suffering from a dump in the RMB and pullback in commodities prices. Key standouts on today’s calendar come in the form of an ECB Guindos speech, Eurozone industrial production, US import prices, Michigan sentiment, a Fed Kashkari speech, and an ECB Schnabel speech.USDCAD – technical overview
The latest surge back above 1.3000 ends a period of bearish consolidation and suggests the market is in the process of carving out a more significant longer-term base. Next key resistance now comes in up into the 1.3500 area. Any setbacks should be very well supported down into the 1.2500 area.USDCAD – fundamental overview
Yield differentials, risk off flow and a break of a major psychological barrier are all playing a part in this latest breakdown in the Canadian Dollar. Dealers have been talking about a recent round of buy-stops being triggered in USDCAD on the push through 1.3000 this week. Key standouts on today’s calendar come in the form of an ECB Guindos speech, Eurozone industrial production, US import prices, Michigan sentiment, a Fed Kashkari speech, and an ECB Schnabel speech.NZDUSD – technical overview
The market has been trending lower since topping out in 2021, making a series of lower highs and lower lows. The focus is now squarely on a retest of the 2015 low which comes in just ahead of 0.6100. Back above 0.6570 would be required to take the immediate pressure off the downside.NZDUSD – fundamental overview
The New Zealand Dollar has been under constant pressure over the past several weeks, with the currency sinking to its lowest levels against the Buck since 2015 on the back of a persistent wave of global risk liquidation. Key standouts on today’s calendar come in the form of an ECB Guindos speech, Eurozone industrial production, US import prices, Michigan sentiment, a Fed Kashkari speech, and an ECB Schnabel speech.US SPX 500 – technical overview
Longer-term technical studies are in the process of unwinding from extended readings off record highs. Look for rallies to be well capped in favor of lower tops and lower lows. Back above 4,312 will be required at a minimum to take the immediate pressure off the downside. Next major support comes in around 3,400.US SPX 500 – fundamental overview
With so little room for additional central bank accommodation, given an already depressed interest rate environment, the prospect for sustainable runs to the topside on easy money policy incentives and government stimulus, should no longer be as enticing to investors. Meanwhile, ongoing worry associated with coronavirus fallout, rising inflation, and geopolitical tension should continue to weigh more heavily on investor sentiment in 2022.GOLD (SPOT) – technical overview
The 2019 breakout above the 2016 high at 1375 was a significant development, opening the door for fresh record highs. Setbacks should now be well supported above 1800.GOLD (SPOT) – fundamental overview
The yellow metal continues to be well supported on dips with solid demand from medium and longer-term accounts. These players are more concerned about exhausted monetary policy, extended global equities, coronavirus fallout, inflation risk, and geopolitical tension. All of this should keep the commodity well supported, with many market participants also fleeing to the hard asset as the grand dichotomy of record high equities and record low yields comes to an unnerving climax.