


Next 24 hours: Currencies charge higher against the Buck
Today’s report: More technical than bullish
There has been a lot of talk about the rebound into last Friday’s US equities close which prevented stocks from officially trading in bear market territory.
Wake-up call
- German PPI
- retail sales
- traditional correlation
- election
- rate pricing
- risk appetite
- Stocks vulnerable
- Dealers report
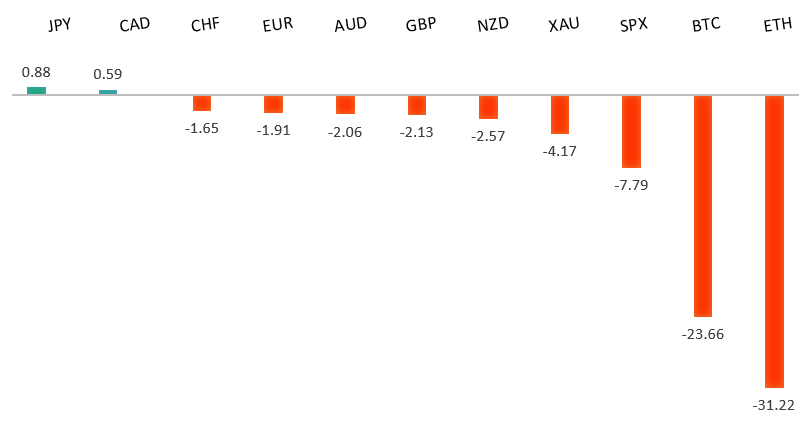
Peformance chart: 30 Day Performance vs. US dollar (%)
Suggested reading
- Davos Forum Is Back With Less Billionaire Starpower, A. Melin, Bloomberg (May 23, 2022)
- Are Electric Taxis Really Getting Closer, C. Middlehurst, Financial Times (May 13, 2022)
Chart talk: Technical & fundamental highlights
Choose pair:
EURUSD – technical overview
The market has come under intense pressure in recent weeks, with setbacks accelerating to retest the multi-year low from 2017. A clear break below 1.0300 now sets up the next downside extension towards parity. At the same time, technical studies are looking rather oversold and warn of a bounce over the coming sessions. Back above 1.0650 would be required at a minimum to take the immediate pressure off the downside.EURUSD – fundamental overview
The Euro has been better supported of late on the back of broad based US Dollar selling and Euro area inflation data which continues to rocket higher, adding pressure on the ECB to raise rates sooner than later. April German producer prices recently printed at their highest level in the series history. Key standouts on today’s calendar come from German Ifo reads, the Chicago Fed national activity index, and a Fed Bostic speech.EURUSD - Technical charts in detail
GBPUSD – technical overview
The recent drop below 1.2500 has accelerated declines, with the market firmly focused on next key support in the form of the 2019 low around 1.1960. However, if indeed we do see a test of this level over the coming days, additional setbacks should be very well supported with technical studies highly extended and a bullish reversal anticipated. Back above 1.2640 will be required to take the immediate pressure off the downside.GBPUSD – fundamental overview
The Pound has managed to shrug off record low consumer confidence data, instead focusing on an impressive UK retail sales number and broad based US Dollar outflows. Key standouts on today’s calendar come from German Ifo reads, the Chicago Fed national activity index, and a Fed Bostic speech.USDJPY – technical overview
The market has rocketed higher to its highest levels since 2002 after breaking through the 2015 high. Technical studies are however in the process of unwinding from overbought readings, with scope for a sizable correction in the weeks ahead. Look for additional upside from here to be limited to the 130.00 area for now. A break back below 127.00 would confirm the likelihood of a deeper pullback.USDJPY – fundamental overview
We are finally seeing evidence of a Yen that has perhaps fallen a little too hard and fast on monetary policy divergence between the BOJ and Fed. Instead, recent price action suggests the Yen is still in demand on the back of traditional correlations with risk off flow. Key standouts on today’s calendar come from German Ifo reads, the Chicago Fed national activity index, and a Fed Bostic speech.AUDUSD – technical overview
The market has dropped back to a critical internal support level in the form of the 2016 low. A breakdown below this level would open the door for a bearish continuation towards 0.6000. Back above 0.7265 would be required to take the immediate pressure off the downside.AUDUSD – fundamental overview
The Australian Dollar has extended its recovery on the back of better bid equities and commodities. We've also seen Aussie demand after outgoing PM Morrison conceded defeat in Saturday's federal election and resigned, paving the way for Governor-General Hurley to appoint Labor leader Albanese as the new leader. Key standouts on today’s calendar come from German Ifo reads, the Chicago Fed national activity index, and a Fed Bostic speech.USDCAD – technical overview
The latest surge back above 1.3000 ends a period of bearish consolidation and suggests the market is in the process of carving out a more significant longer-term base. Next key resistance now comes in up into the 1.3500 area. Any setbacks should be very well supported down into the 1.2500 area.USDCAD – fundamental overview
Bank of Canada rate hike pricing has become even more aggressive of late, with the market pricing the possibility of a 75 basis point hike at the upcoming meeting. This along with a recovery in stocks and commodities have been bolstering the Canadian Dollar. Key standouts on today’s calendar come from German Ifo reads, the Chicago Fed national activity index, and a Fed Bostic speech.NZDUSD – technical overview
The market has been trending lower since topping out in 2021, making a series of lower highs and lower lows. The focus is now squarely on a retest of the 2015 low which comes in just ahead of 0.6100. Back above 0.6570 would be required to take the immediate pressure off the downside.NZDUSD – fundamental overview
The New Zealand Dollar has extended its recovery on the back of better bid equities and commodities. Key standouts on today’s calendar come from German Ifo reads, the Chicago Fed national activity index, and a Fed Bostic speech.US SPX 500 – technical overview
Longer-term technical studies are in the process of unwinding from extended readings off record highs. Look for rallies to be well capped in favor of lower tops and lower lows. Back above 4,312 will be required at a minimum to take the immediate pressure off the downside. Next major support comes in around 3,400.US SPX 500 – fundamental overview
With so little room for additional central bank accommodation, given an already depressed interest rate environment, the prospect for sustainable runs to the topside on easy money policy incentives and government stimulus, should no longer be as enticing to investors. Meanwhile, ongoing worry associated with coronavirus fallout, rising inflation, and geopolitical tension should continue to weigh more heavily on investor sentiment in 2022.GOLD (SPOT) – technical overview
The 2019 breakout above the 2016 high at 1375 was a significant development, opening the door for fresh record highs. Setbacks should now be well supported above 1700.GOLD (SPOT) – fundamental overview
The yellow metal continues to be well supported on dips with solid demand from medium and longer-term accounts. These players are more concerned about exhausted monetary policy, extended global equities, coronavirus fallout, inflation risk, and geopolitical tension. All of this should keep the commodity well supported, with many market participants also fleeing to the hard asset as the grand dichotomy of record high equities and record low yields comes to an unnerving climax.