


Today’s report: Watch out for that core PCE print
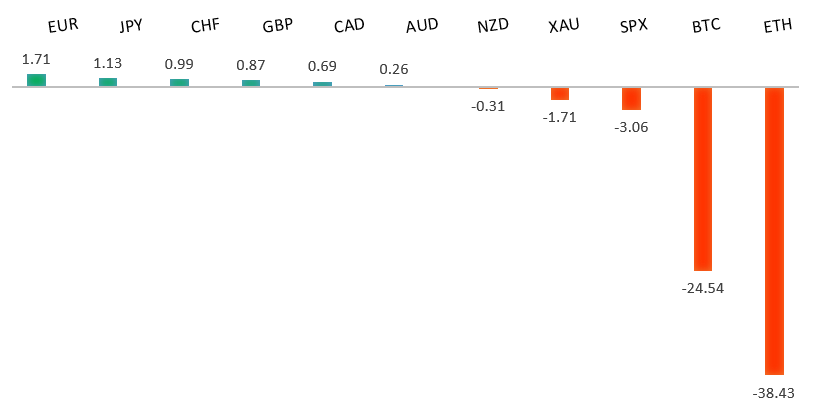
The market continues to reprice Fed rate hike expectations and this has been very clearly reflected in price action, with stocks higher and the US Dollar lower. After an impressive period of across the board strength, the US Dollar is now tracking lower against most currencies over the past 30 days.
Wake-up call
- Fed repricing
- financial aid
- Kuroda comments
- China worry
- labor data
- Consumer confidence
- Stocks vulnerable
- Dealers report
Peformance chart: 30 Day Performance vs. US dollar (%)
Suggested reading
- UK Stock Market’s Valuation Discount Is Shrinking Quickly, M. Msika, Bloomberg (May 27, 2022)
- Stagflation Fears Are At 2008 Levels, M. Rzepczynski, Disciplined Global Macro (May 24, 2022)
Chart talk: Technical & fundamental highlights
Choose pair:
EURUSD – technical overview
The market has come under intense pressure in recent weeks, with setbacks accelerating to retest the multi-year low from 2017. A clear break below 1.0300 now sets up the next downside extension towards parity. At the same time, technical studies have been in the process of unwinding from oversold. But back above 1.1000 would be required at a minimum to take the immediate pressure off the downside.EURUSD – fundamental overview
The Euro is tracking with a bid tone into the end of the week. The single currency had initially benefited from stronger local data and more hawkish comments out from ECB Lagarde, before getting an added push on a repricing of Fed rate hike expectations. Key standouts on today’s calendar come from US personal income and spending, core PCE, and Michigan sentiment.EURUSD - Technical charts in detail
GBPUSD – technical overview
The recent drop below 1.2500 has accelerated declines, with the market firmly focused on next key support in the form of the 2019 low around 1.1960. However, if indeed we do see a test of this level over the coming days, additional setbacks should be very well supported with technical studies highly extended and a bullish reversal anticipated. Back above 1.2700 will be required to take the immediate pressure off the downside.GBPUSD – fundamental overview
The Pound has been bid on the back of US Dollar selling from a repricing of Fed rate hike expectations. But we have seen some selling into rallies after the UK government announced a large financial aid package. Key standouts on today’s calendar come from US personal income and spending, core PCE, and Michigan sentiment.USDJPY – technical overview
The market has rocketed higher to its highest levels since 2002 after breaking through the 2015 high. Technical studies are however in the process of unwinding from overbought readings, with scope for a sizable correction in the weeks ahead. Look for additional upside from here to be limited to the 130.00 area for now. A break back below 127.00 would confirm the likelihood of a deeper pullback.USDJPY – fundamental overview
We are finally seeing evidence of a Yen that has perhaps fallen a little too hard and fast on monetary policy divergence between the BOJ and Fed. Most recently, BOJ Kuroda was on the wires saying further US rate hikes wouldn't necessarily lead to Yen weakness. Key standouts on today’s calendar come from US personal income and spending, core PCE, and Michigan sentiment.AUDUSD – technical overview
The market has dropped back to a critical internal support level in the form of the 2016 low. A breakdown below this level would open the door for a bearish continuation towards 0.6000. Back above 0.7265 would be required to take the immediate pressure off the downside.AUDUSD – fundamental overview
The Australian Dollar has extended its recovery on the back of higher stocks and a repricing of Fed rate hike expectations. At the same time, gains have been mitigated given the more downbeat economic outlook in China. Key standouts on today’s calendar come from US personal income and spending, core PCE, and Michigan sentiment.USDCAD – technical overview
The latest surge back above 1.3000 ends a period of bearish consolidation and suggests the market is in the process of carving out a more significant longer-term base. Next key resistance now comes in up into the 1.3500 area. Any setbacks should be very well supported down into the 1.2500 area.USDCAD – fundamental overview
The Canadian Dollar has been in recovery mode, getting help from hot labor market data, a repricing of Fed rate hike expectations, higher stocks and better bid oil. Key standouts on today’s calendar come from US personal income and spending, core PCE, and Michigan sentiment.NZDUSD – technical overview
The market has been trending lower since topping out in 2021, making a series of lower highs and lower lows. The focus is now squarely on a retest of the 2015 low which comes in just ahead of 0.6100. Back above 0.6570 would be required to take the immediate pressure off the downside.NZDUSD – fundamental overview
The New Zealand Dollar has mostly been in recovery mode on account of a repricing of Fed rate hike expectations and higher stocks. Interestingly enough, the market has been less impressed with this week's consecutive RBNZ 50bps rate hike. Economic data in New Zealand remains concerning on many levels and the more downbeat outlook on China hasn't helped either. Key standouts on today’s calendar come from US personal income and spending, core PCE, and Michigan sentiment.US SPX 500 – technical overview
Longer-term technical studies are in the process of unwinding from extended readings off record highs. Look for rallies to be well capped in favor of lower tops and lower lows. Back above 4,312 will be required at a minimum to take the immediate pressure off the downside. Next major support comes in around 3,400.US SPX 500 – fundamental overview
With so little room for additional central bank accommodation, given an already depressed interest rate environment, the prospect for sustainable runs to the topside on easy money policy incentives and government stimulus, should no longer be as enticing to investors. Meanwhile, ongoing worry associated with coronavirus fallout, rising inflation, and geopolitical tension should continue to weigh more heavily on investor sentiment in 2022.GOLD (SPOT) – technical overview
The 2019 breakout above the 2016 high at 1375 was a significant development, opening the door for fresh record highs. Setbacks should now be well supported above 1700.GOLD (SPOT) – fundamental overview
The yellow metal continues to be well supported on dips with solid demand from medium and longer-term accounts. These players are more concerned about exhausted monetary policy, extended global equities, coronavirus fallout, inflation risk, and geopolitical tension. All of this should keep the commodity well supported, with many market participants also fleeing to the hard asset as the grand dichotomy of record high equities and record low yields comes to an unnerving climax.