


Today’s report: Sentiment shifts on hawkish wave of Fed speak
Plenty of worry of stagflation out there and now another round of hawkish Fed talk that has the market reconsidering its decision to scale back Fed rate hike expectations.
Wake-up call
- retail sales
- house prices
- Policy divergence
- iron ore
- decision aftermath
- hawkish Hawkesby
- Stocks vulnerable
- Dealers report
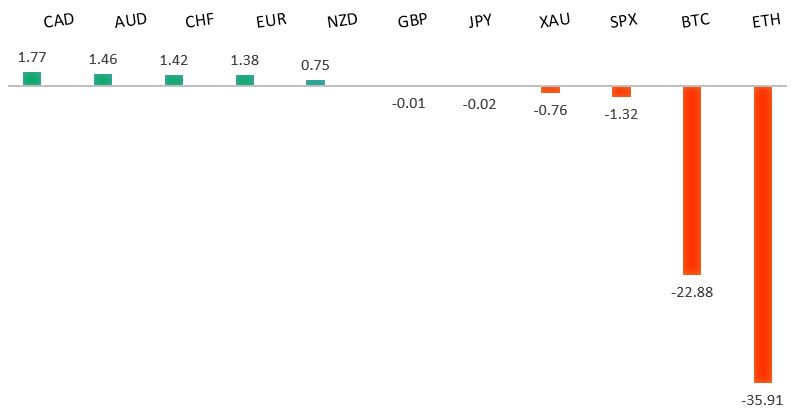
Peformance chart: 30 Day Performance vs. US dollar (%)
Suggested reading
- Bond Yields Are Signaling an Infeasible Compromise, J. Authers, Bloomberg (June 2, 2022)
- Can high-tech urban farming reduce Singapore's reliance on imports?, O. Telling, FT (June 1, 2022)
Chart talk: Technical & fundamental highlights
Choose pair:
EURUSD – technical overview
The market has come under intense pressure in recent weeks, with setbacks accelerating to retest the multi-year low from 2017. A clear break below 1.0300 now sets up the next downside extension towards parity. At the same time, technical studies have been in the process of unwinding from oversold. But back above 1.1000 would be required at a minimum to take the immediate pressure off the downside.EURUSD – fundamental overview
German retail sales was a real stinker on Wednesday, producing the biggest decline of the year. This along with a downturn in stocks was behind the latest retreat in the Euro. Key standouts on today’s calendar come from Eurozone producer prices, US ADP employment, US initial jobless claims, Canada building permits, US factory orders, and some Fed speak.EURUSD - Technical charts in detail
GBPUSD – technical overview
The market continues to be exceptionally well supported on dips down into the 1.2000 area, with the latest setback once again holding up ahead of the barrier. Overall, the daily trend remains bearish, though there are signs of the market wanting to put in a meaningful bottom ahead of the next major upside extension. Look for a clear break back above 1.3000 to strengthen this outlook.GBPUSD – fundamental overview
The Pound has extended its recent decline as stagflation fears ramp up in the UK. UK house prices have risen for the tenth consecutive month. The market is worried the BOE could be a little too aggressive with its rate hike timeline. Key standouts on today’s calendar come from Eurozone producer prices, US ADP employment, US initial jobless claims, Canada building permits, US factory orders, and some Fed speak.USDJPY – technical overview
The market has rocketed higher to its highest levels since 2002 after breaking through the 2015 high. Technical studies are however in the process of unwinding from overbought readings, with scope for a sizable correction in the weeks ahead. Look for additional upside from here to be limited to the 130.00 area for now. A break back below 127.00 would confirm the likelihood of a deeper pullback.USDJPY – fundamental overview
Policy divergence is playing back into the picture over the last couple of sessions, with market participants once again focusing on yield differentials that continue to weigh heavily in the US Dollar's favor. Key standouts on today’s calendar come from Eurozone producer prices, US ADP employment, US initial jobless claims, Canada building permits, US factory orders, and some Fed speak.AUDUSD – technical overview
The market has recently dropped back to a critical internal support level in the form of the 2016 low. A breakdown below this level would open the door for a bearish continuation towards 0.6000. Back above 0.7265 would be required to take the immediate pressure off the downside.AUDUSD – fundamental overview
The Australian Dollar is rolling back over into the latter half of the week, this on the back of renewed downside pressure in stocks. At the same time, rallying iron ore prices and some solid Aussie data have managed to mitigate the decline somewhat. Key standouts on today’s calendar come from Eurozone producer prices, US ADP employment, US initial jobless claims, Canada building permits, US factory orders, and some Fed speak.USDCAD – technical overview
A recent surge back above 1.3000 signals an end to a period of bearish consolidation and suggests the market is in the process of carving out a more significant longer-term base. Next key resistance now comes in up into the 1.3500 area. Any setbacks should be very well supported down into the 1.2500 area.USDCAD – fundamental overview
It was a classic case of buy the rumor, sell the fact on Wednesday. The Bank of Canada came out and raised rates by 50 basis points as widely expected, leaving the market in a position to book profit on long Loonie exposure in the aftermath. We also saw downside pressure on the Canadian Dollar coming from lower oil prices and a downturn in US equities. Key standouts on today’s calendar come from Eurozone producer prices, US ADP employment, US initial jobless claims, Canada building permits, US factory orders, and some Fed speak.NZDUSD – technical overview
The market has been trending lower since topping out in 2021, making a series of lower highs and lower lows. The focus is now squarely on a retest of the 2015 low which comes in just ahead of 0.6100. Back above 0.6570 would be required to take the immediate pressure off the downside.NZDUSD – fundamental overview
Stocks have turned back down, while New Zealand data has been unimpressive, most recently in the form of slumping business confidence and slowing house prices. This has opened renewed downside pressure on Kiwi despite hawkish comments from RBNZ deputy governor Hawkesby earlier this week. Key standouts on today’s calendar come from Eurozone producer prices, US ADP employment, US initial jobless claims, Canada building permits, US factory orders, and some Fed speak.US SPX 500 – technical overview
Longer-term technical studies are in the process of unwinding from extended readings off record highs. Look for rallies to be well capped in favor of lower tops and lower lows. Back above 4,312 will be required at a minimum to take the immediate pressure off the downside. Next major support comes in around 3,400.US SPX 500 – fundamental overview
With so little room for additional central bank accommodation, given an already depressed interest rate environment, the prospect for sustainable runs to the topside on easy money policy incentives and government stimulus, should no longer be as enticing to investors. Meanwhile, ongoing worry associated with coronavirus fallout, rising inflation, and geopolitical tension should continue to weigh more heavily on investor sentiment in 2022.GOLD (SPOT) – technical overview
The 2019 breakout above the 2016 high at 1375 was a significant development, opening the door for fresh record highs. Setbacks should now be well supported above 1700.GOLD (SPOT) – fundamental overview
The yellow metal continues to be well supported on dips with solid demand from medium and longer-term accounts. These players are more concerned about exhausted monetary policy, extended global equities, coronavirus fallout, inflation risk, and geopolitical tension. All of this should keep the commodity well supported, with many market participants also fleeing to the hard asset as the grand dichotomy of record high equities and record low yields comes to an unnerving climax.