


Next 24 hours: Ominous signs
Today’s report: Inflation story just can't be ignored
The market continues to be worried about the impact of higher rates and its lack of ability to influence the Fed as it once did. The game changer this time round has been inflation.
Wake-up call
- Policy divergence
- PM Johnson
- easy policy
- AUDUSD RBA decision more hawkish leaning
- Speculative traders
- cross rate
- Stocks vulnerable
- Dealers report
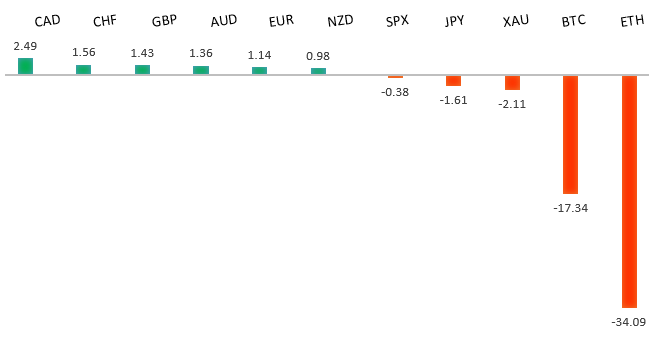
Peformance chart: 30 Day Performance vs. US dollar (%)
Suggested reading
- Gold’s Haven Appeal Burnished by Growth Warnings, R. Pakiam, Bloomberg (June 7, 2022)
- Learning to Love 5G and Beyond, A. Gross, Financial Times (June 6, 2022)
Chart talk: Technical & fundamental highlights
Choose pair:
EURUSD – technical overview
The market has come under intense pressure in recent weeks, with setbacks accelerating to retest the multi-year low from 2017. A clear break below 1.0300 now sets up the next downside extension towards parity. At the same time, technical studies have been in the process of unwinding from oversold. But back above 1.1000 would be required at a minimum to take the immediate pressure off the downside.EURUSD – fundamental overview
The Euro extended declines seen from last week's soft round of Eurozone data, with most of the Monday setbacks coming from yield differential themes and monetary policy divergence. Key standouts on today’s calendar come from German factory orders, Eurozone, German and UK PMI reads, Canada trade, US trade, and Canada Ivey PMIs.EURUSD - Technical charts in detail
GBPUSD – technical overview
The market continues to be exceptionally well supported on dips down into the 1.2000 area, with the latest setback once again holding up ahead of the barrier. Overall, the daily trend remains bearish, though there are signs of the market wanting to put in a meaningful bottom ahead of the next major upside extension. Look for a clear break back above 1.3000 to strengthen this outlook.GBPUSD – fundamental overview
UK markets have priced another 150 bps of rate hikes by year end. The Pound has held up on this along with PM Johnson surviving the no-confidence vote. Still, many expect the PM's days are now numbered given the sheer number of Tory lawmakers voicing no confidence in Johnson's leadership. Key standouts on today’s calendar come from German factory orders, Eurozone, German and UK PMI reads, Canada trade, US trade, and Canada Ivey PMIs.USDJPY – technical overview
The market has rocketed higher to its highest levels since 2002 after breaking through the 2015 high. Technical studies are however looking stretched, with scope for a sizable consolidation and correction in the weeks ahead. Look for additional upside from here to be limited to the 135.00 area. A break back below 130.00 would take the immediate pressure off the topside.USDJPY – fundamental overview
Policy divergence continues to play a strong hand here, with market participants once again focusing on yield differentials that continue to weigh heavily in the US Dollar's favor. The BOJ is clearly still committed to easy policy despite what's going on with other major central banks and the impact on the Yen, now at a 20 year low against the Buck. Key standouts on today’s calendar come from German factory orders, Eurozone, German and UK PMI reads, Canada trade, US trade, and Canada Ivey PMIs.AUDUSD – technical overview
The market has been in recovery mode since bottoming out off the yearly low. Overall however, conditions remain quite choppy, and while the short-term pressure has been taken off the downside, rallies towards 0.7500 should be very well offered.AUDUSD – fundamental overview
There Australian Dollar has rallied in the initial aftermath of the more hawkish than expected RBA decision in which the central bank raised rates by 50 basis points and communicated a commitment to do what is necessary to ensure that inflation returns to target. Key standouts on today’s calendar come from German factory orders, Eurozone, German and UK PMI reads, Canada trade, US trade, and Canada Ivey PMIs.USDCAD – technical overview
A recent surge back above 1.3000 signals an end to a period of bearish consolidation and suggests the market is in the process of carving out a more significant longer-term base. Next key resistance now comes in up into the 1.3500 area. Setbacks should be very well supported down into the 1.2500 area.USDCAD – fundamental overview
Despite all of the upside in the Canadian Dollar in the aftermath of last week's hawkish Bank of Canada decision, speculative traders continue to bet against the Loonie. Risk off flow and some selling in commodities has also inspired renewed Canadian Dollar selling. Key standouts on today’s calendar come from German factory orders, Eurozone, German and UK PMI reads, Canada trade, US trade, and Canada Ivey PMIs.NZDUSD – technical overview
The market has been in recovery mode since bottoming out off the yearly low. Overall however, conditions remain quite choppy, and while the short-term pressure has been taken off the downside, rallies should be very well offered.NZDUSD – fundamental overview
Broad based risk off flow has resulted in renewed downside pressure in the New Zealand Dollar. We've also seen Kiwi selling on cross related demand for AUDNZD in the aftermath of today's hawkish leaning RBA decision. Key standouts on today’s calendar come from German factory orders, Eurozone, German and UK PMI reads, Canada trade, US trade, and Canada Ivey PMIs.US SPX 500 – technical overview
Longer-term technical studies are in the process of unwinding from extended readings off record highs. Look for rallies to be well capped in favor of lower tops and lower lows. Back above 4,312 will be required at a minimum to take the immediate pressure off the downside. Next major support comes in around 3,400.US SPX 500 – fundamental overview
With so little room for additional central bank accommodation, given an already depressed interest rate environment, the prospect for sustainable runs to the topside on easy money policy incentives and government stimulus, should no longer be as enticing to investors. Meanwhile, ongoing worry associated with coronavirus fallout, rising inflation, and geopolitical tension should continue to weigh more heavily on investor sentiment in 2022.GOLD (SPOT) – technical overview
The 2019 breakout above the 2016 high at 1375 was a significant development, opening the door for fresh record highs. Setbacks should now be well supported above 1700.GOLD (SPOT) – fundamental overview
The yellow metal continues to be well supported on dips with solid demand from medium and longer-term accounts. These players are more concerned about exhausted monetary policy, extended global equities, coronavirus fallout, inflation risk, and geopolitical tension. All of this should keep the commodity well supported, with many market participants also fleeing to the hard asset as the grand dichotomy of record high equities and record low yields comes to an unnerving climax.