


Next 24 hours: Why today's US producer prices read is important
Today’s report: How aggressive will the Fed be?
Calls for consecutive 75 basis point rate hikes from the Fed have ramped up and the market is nervous. The fallout in financial markets has been severe, with stocks dropping to fresh yearly lows and the US Dollar up across the board.
Wake-up call
- sovereign spreads
- Awful data
- Intervention chatter
- risk off
- jobs report
- US inflation
- Stocks vulnerable
- Dealers report
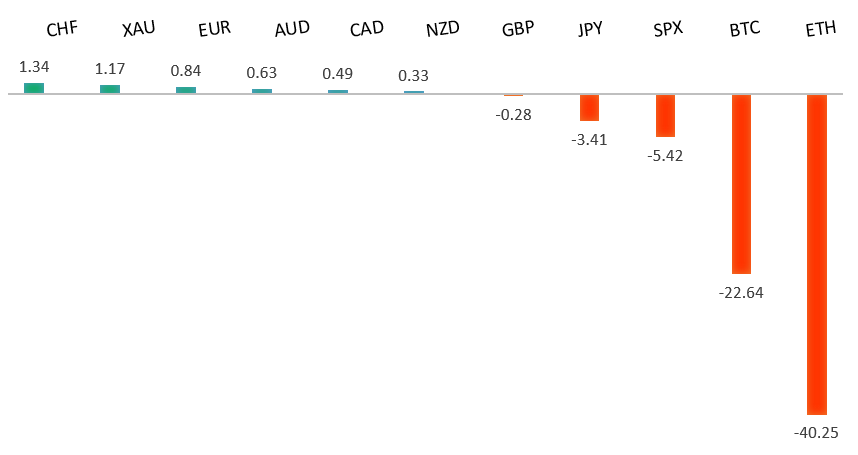
Peformance chart: 30 Day Performance vs. US dollar (%)
Suggested reading
- ECB Needs a Bazooka to Close Bond Spreads, M. Ashworth, Bloomberg (June 14, 2022)
- FT Interviews Astronaut Samantha Cristoforetti in Space, P. Hollinger, Financial Times (June 10, 2022)
Chart talk: Technical & fundamental highlights
Choose pair:
EURUSD – technical overview
The market has come under intense pressure in recent weeks, with setbacks accelerating to retest the multi-year low from 2017. A clear break below 1.0300 now sets up the next downside extension towards parity. At the same time, technical studies have been in the process of unwinding from oversold. But back above 1.1000 would be required at a minimum to take the immediate pressure off the downside.EURUSD – fundamental overview
The Euro hasn't been able to escape fallout from a blowout in sovereign spreads and the beating in Italian and Greek debt. It's becoming increasingly apparent the ECB can no longer support sovereign markets with inflation running at 8%. All of this coming at a time when yield differentials with the US Dollar tilt more heavily in the Buck's favour in the aftermath of a hot US CPI print. Key standouts on today’s calendar come in the form of German inflation, UK employment, German wholesale prices, Eurozone and German ZEW reads, and US producer prices.EURUSD - Technical charts in detail
GBPUSD – technical overview
The market continues to be exceptionally well supported on dips down into the 1.2000 area, with the latest setback once again holding up ahead of the barrier. Overall, the daily trend remains bearish, though there are signs of the market wanting to put in a meaningful bottom ahead of the next major upside extension. Look for a clear break back above 1.2700 to strengthen this outlook.GBPUSD – fundamental overview
The Pound took a heavy hit on Monday, with the currency suffering from a combination of awful UK data highlighted by GDP, construction output and industrial production, and a massive flight to safety into the US Dollar. Key standouts on today’s calendar come in the form of German inflation, UK employment, German wholesale prices, Eurozone and German ZEW reads, and US producer prices.USDJPY – technical overview
The market has rocketed higher to its highest levels since 1998 after breaking through the 2002 high. Technical studies are however looking stretched, with scope for a sizable consolidation and correction in the weeks ahead. Look for additional upside from here to be limited to the 135.00 area. A break back below 130.00 would take the immediate pressure off the topside.USDJPY – fundamental overview
Policy divergence continues to play a strong hand here, with market participants once again focusing on yield differentials that weigh heavily in the US Dollar's favor. The BOJ is clearly still committed to easy policy despite what's going on with other major central banks and the impact on the Yen, now at its lowest levels against the Buck since 1998. There has been some talk of intervention around 135.00, though at this stage, it's too early to tell if this is indeed the case. Key standouts on today’s calendar come in the form of German inflation, UK employment, German wholesale prices, Eurozone and German ZEW reads, and US producer prices.AUDUSD – technical overview
Overall pressure remains on the downside and conditions remain quite choppy. A break back above 0.7900 would be required to force a shift in the structure and suggest we are seeing a more significant bullish reversal. Until then, scope exists for a retest and break of the yearly low.AUDUSD – fundamental overview
Most of the latest round of setbacks in the Australian Dollar come from broad based risk off flow in the aftermath of last Friday's hot US inflation data. Key standouts on today’s calendar come in the form of German inflation, UK employment, German wholesale prices, Eurozone and German ZEW reads, and US producer prices.USDCAD – technical overview
A recent surge back above 1.3000 signals an end to a period of bearish consolidation and suggests the market is in the process of carving out a more significant longer-term base. Next key resistance now comes in up into the 1.3500 area. Setbacks should be very well supported down into the 1.2500 area.USDCAD – fundamental overview
Last Friday's jobs report out of Canada was impressive, with the data producing record low unemployment. Nevertheless, the bigger focus has clearly been on massive risk liquidation flow in the aftermath of the hot US inflation print. All of this has opened a major round of selling in the Canadian Dollar. Key standouts on today’s calendar come in the form of German inflation, UK employment, German wholesale prices, Eurozone and German ZEW reads, and US producer prices.NZDUSD – technical overview
Overall pressure remains on the downside and conditions remain quite choppy. A break back above 0.6600 would be required to force a shift in the structure and suggest we are seeing a more significant bullish reversal. Until then, scope exists for a retest and break of the yearly low.NZDUSD – fundamental overview
Most of the latest round of setbacks in the New Zealand Dollar come from broad based risk off flow in the aftermath of last Friday's hot US inflation data. Key standouts on today’s calendar come in the form of German inflation, UK employment, German wholesale prices, Eurozone and German ZEW reads, and US producer prices.US SPX 500 – technical overview
Longer-term technical studies are in the process of unwinding from extended readings off record highs. Look for rallies to be well capped in favor of lower tops and lower lows. Back above 4,206 will be required at a minimum to take the immediate pressure off the downside. Next major support comes in around 3,400.US SPX 500 – fundamental overview
With so little room for additional central bank accommodation, given an already depressed interest rate environment, the prospect for sustainable runs to the topside on easy money policy incentives and government stimulus, should no longer be as enticing to investors. Meanwhile, ongoing worry associated with rising inflation and slower growth should continue to weigh more heavily on investor sentiment in 2022.GOLD (SPOT) – technical overview
The 2019 breakout above the 2016 high at 1375 was a significant development, opening the door for fresh record highs. Setbacks should now be well supported above 1700.GOLD (SPOT) – fundamental overview
The yellow metal continues to be well supported on dips with solid demand from medium and longer-term accounts. These players are more concerned about exhausted monetary policy, extended global equities, and inflation risk. All of this should keep the commodity well supported, with many market participants also fleeing to the hard asset as the grand dichotomy of record high equities and record low yields comes to an unnerving climax.