


Today’s report: BOJ refuses to play with the other central banks
The Bank of Japan refuses to play the same game as the other major central banks including even the SNB, with the BOJ leaving policy on hold earlier today. The resulting price action has seen the Yen sell-off back towards this week’s lowest level against the US Dollar since 1998.
Wake-up call
- rate hikes
- Hawkish BOE
- No change
- jobs data
- home prices
- USD outflows
- Stocks vulnerable
- Dealers report
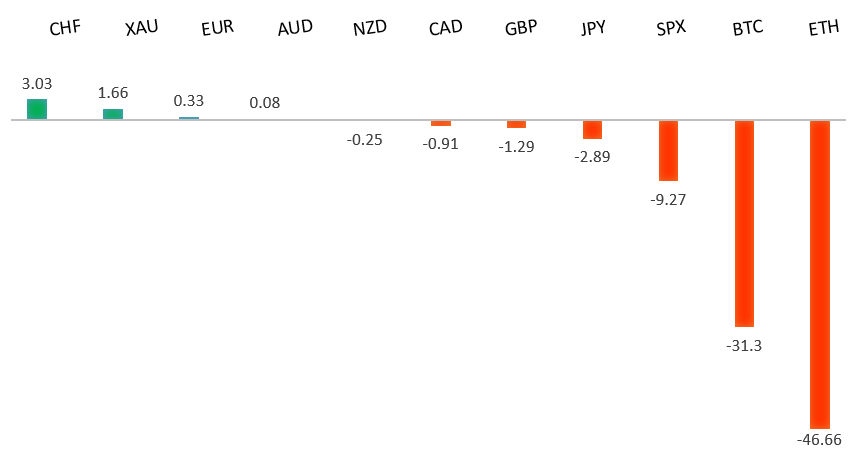
Peformance chart: 30 Day Performance vs. US dollar (%)
Suggested reading
- Post-Lehman Path Makes a Case for Buying the Rout, J. Authers, Bloomberg (June 17, 2022)
- Price Stability Is Dead And We Killed It, E. Price, FT Alphaville (June 16, 2022)
Chart talk: Technical & fundamental highlights
Choose pair:
EURUSD – technical overview
The market has come under intense pressure in recent weeks, with setbacks accelerating to retest the multi-year low from 2017. A clear break below 1.0300 now sets up the next downside extension towards parity. At the same time, technical studies have been in the process of unwinding from oversold. But back above 1.1000 would be required at a minimum to take the immediate pressure off the downside.EURUSD – fundamental overview
The FX market is anticipating the ECB will be dragged into faster tightening in light of aggressive moves at other central banks. Traders are now pricing 190 bps of higher rates by year end, up from 140 bps pre-ECB meeting. The ECB has also announced intentions to mitigate fragmentation risk with a new bond-buying tool. Key standouts on today’s calendar come from, Eurozone inflation, Canada producer prices, a Fed Chair Powell speech, and US industrial production.EURUSD - Technical charts in detail
GBPUSD – technical overview
The market continues to be exceptionally well supported on dips down into the 1.2000 area, with the latest setback once again holding up around the barrier. Overall, the daily trend remains bearish, though there are signs of the market wanting to put in a meaningful bottom ahead of the next major upside extension. Look for a clear break back above 1.2700 to strengthen this outlook. A monthly close below 1.2000 would force a rethink of the outlook.GBPUSD – fundamental overview
Though the BOE only went with a 25 basis point rate hike, this in conjunction with some hawkish talk was enough to open the door for relative outperformance in the Pound on Thursday. The Pound had struggled mightily earlier in the week on the back of a wave of horrid data. Key standouts on today’s calendar come from, Eurozone inflation, Canada producer prices, a Fed Chair Powell speech, and US industrial production.USDJPY – technical overview
The market has rocketed higher to its highest levels since 1998 after breaking through the 2002 high. Technical studies are however looking stretched, with scope for a sizable consolidation and correction in the weeks ahead. Look for additional upside from here to be limited to the 135.00 area. A break back below 130.00 would take the immediate pressure off the topside.USDJPY – fundamental overview
No changes to BOJ policy with the central bank remaining on hold earlier today. Policy divergence continues to play a strong hand here, with market participants focusing on yield differentials that weigh heavily in the US Dollar's favor. The BOJ is clearly still committed to easy policy despite what's going on with other major central banks and the impact on the Yen, now at its lowest levels against the Buck since 1998. Key standouts on today’s calendar come from, Eurozone inflation, Canada producer prices, a Fed Chair Powell speech, and US industrial production.AUDUSD – technical overview
Overall pressure remains on the downside and conditions remain quite choppy. A break back above 0.7900 would be required to force a shift in the structure and suggest we are seeing a more significant bullish reversal. Until then, scope exists for a retest and break of the yearly low.AUDUSD – fundamental overview
The Australian Dollar is trying its best to feel better into the end of the week, this after a wave of US Dollar selling post Fed decision, and a better round of Aussie data highlighted by employment numbers. Still, how things play out in US equities will ultimately dictate flow. Key standouts on today’s calendar come from, Eurozone inflation, Canada producer prices, a Fed Chair Powell speech, and US industrial production.USDCAD – technical overview
A recent surge back above 1.3000 signals an end to a period of bearish consolidation and suggests the market is in the process of carving out a more significant longer-term base. Next key resistance now comes in up into the 1.3500 area. Setbacks should be very well supported down into the 1.2500 area.USDCAD – fundamental overview
A second monthly decline in Canadian home prices has revealed cracks in a massively overleveraged real estate sector. The Canadian Dollar has been under pressure of late on the back of this along with the bigger picture risk off flow. Key standouts on today’s calendar come from, Eurozone inflation, Canada producer prices, a Fed Chair Powell speech, and US industrial production.NZDUSD – technical overview
Overall pressure remains on the downside and conditions remain quite choppy. A break back above 0.6600 would be required to force a shift in the structure and suggest we are seeing a more significant bullish reversal. Until then, scope exists for fresh yearly lows and a retest of the 2015 low down towards 0.6100.NZDUSD – fundamental overview
The New Zealand Dollar has been under pressure of late but has managed to recover out from this week's fresh yearly low against the Buck after a wave of US Dollar selling kicked in post Fed decision. Key standouts on today’s calendar come from, Eurozone inflation, Canada producer prices, a Fed Chair Powell speech, and US industrial production.US SPX 500 – technical overview
Longer-term technical studies are in the process of unwinding from extended readings off record highs. Look for rallies to be well capped in favor of lower tops and lower lows. Back above 4,206 will be required at a minimum to take the immediate pressure off the downside. Next major support comes in around 3,400.US SPX 500 – fundamental overview
With so little room for additional central bank accommodation, given an already depressed interest rate environment, the prospect for sustainable runs to the topside on easy money policy incentives and government stimulus, should no longer be as enticing to investors. Meanwhile, ongoing worry associated with rising inflation and slower growth should continue to weigh more heavily on investor sentiment in 2022.GOLD (SPOT) – technical overview
The 2019 breakout above the 2016 high at 1375 was a significant development, opening the door for fresh record highs. Setbacks should now be well supported above 1700.GOLD (SPOT) – fundamental overview
The yellow metal continues to be well supported on dips with solid demand from medium and longer-term accounts. These players are more concerned about exhausted monetary policy, extended global equities, and inflation risk. All of this should keep the commodity well supported, with many market participants also fleeing to the hard asset as the grand dichotomy of record high equities and record low yields comes to an unnerving climax.