


Today’s report: Investors question Fed Chair's optimism
Jerome Powell will offer his second day of testimony on this Thursday, though we’re not sure if we should be expecting much more than what was already offered. We’re also not sure the market is really buying into any of it anyway.
Wake-up call
- Sovereign spreads
- UK inflation
- BOJ Minutes
- Iron ore
- Oil declines
- RMB devaluation
- Stocks vulnerable
- Dealers report
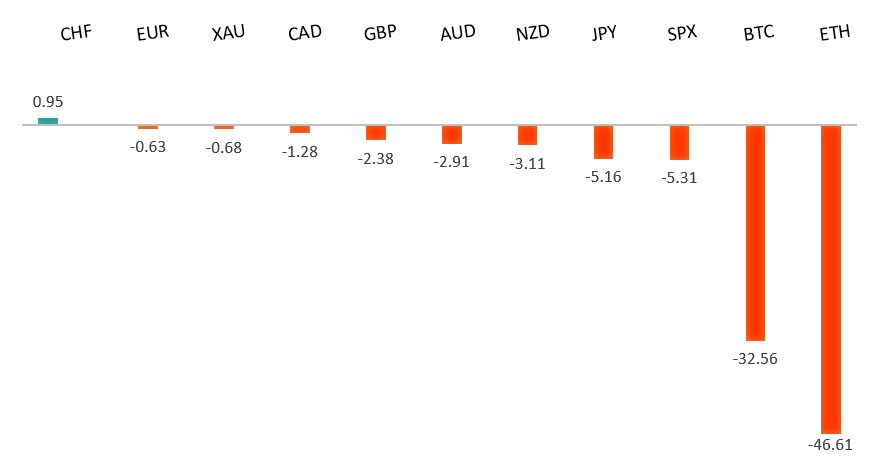
Peformance chart: 30 Day Performance vs. US dollar (%)
Suggested reading
- Rising Yields Will Test EU’s 800 Billion-Euro Promise, M. Ashworth, Bloomberg (June 23, 2022)
- How Tech Companies Are Betting on the Metaverse, G. Bobillot, Financial Times (May 30, 2022)
Chart talk: Technical & fundamental highlights
Choose pair:
EURUSD – technical overview
The market has come under intense pressure in recent weeks, with setbacks accelerating to retest the multi-year low from 2017. A clear break below 1.0300 now sets up the next downside extension towards parity. At the same time, technical studies have been in the process of unwinding from oversold. But back above 1.1000 would be required at a minimum to take the immediate pressure off the downside.EURUSD – fundamental overview
The Euro edged up a little higher on Wednesday. Sovereign spreads narrowed slightly and the ECB continued to talk about its new anti-fragmentation tool, that is says won't impede monetary policy. Key standouts on today’s calendar come from some PMI reads out of Germany, the Eurozone, and UK, the ECB economic bulletin, Canada manufacturing sales, and US initial jobless claims. We also get another round of testimony from the Fed Chair.EURUSD - Technical charts in detail
GBPUSD – technical overview
The market continues to be exceptionally well supported on dips down into the 1.2000 area, with the latest setback once again holding up around the barrier. Overall, the daily trend remains bearish, though there are signs of the market wanting to put in a meaningful bottom ahead of the next major upside extension. Look for a clear break back above 1.2700 to strengthen this outlook. A monthly close below 1.2000 would force a rethink of the outlook.GBPUSD – fundamental overview
The outlook for the UK economy is all the more in question with inflation rocketing to a 40-year high, the highest reads in the G-7. Having said that, all of this opens the door to a more aggressive policy response from the BOE, which could inspire demand for the Pound on the yield differential implications. Key standouts on today’s calendar come from some PMI reads out of Germany, the Eurozone, and UK, Canada manufacturing sales, and US initial jobless claims. We also get another round of testimony from the Fed Chair.USDJPY – technical overview
The market has rocketed higher to its highest levels since 1998 after breaking through the 2002 high. Technical studies are however looking stretched, with scope for a sizable consolidation and correction in the weeks ahead. Look for additional upside from here to be well capped ahead of 140.00. A break back below 130.00 would take the immediate pressure off the topside.USDJPY – fundamental overview
The Minutes from the latest BOJ Meeting flagged excessive currency volatility as harmful to businesses. Nevertheless, the volatility hasn't been harmful enough to this point to effect any change to monetary policy. The BOJ is clearly still committed to easy policy despite what's going on with other major central banks. Key standouts on today’s calendar come from some PMI reads out of Germany, the Eurozone, and UK, Canada manufacturing sales, and US initial jobless claims. We also get another round of testimony from the Fed Chair.AUDUSD – technical overview
Overall pressure remains on the downside and conditions remain quite choppy. A break back above 0.7900 would be required to force a shift in the structure and suggest we are seeing a more significant bullish reversal. Until then, scope exists for a retest and break of the yearly low.AUDUSD – fundamental overview
Iron ore prices have headed south again and concerns over the outlook for China remain. Meanwhile, broader risk sentiment is still in deterioration mode, and all of this is inviting selling pressure on the Australian Dollar. Key standouts on today’s calendar come from some PMI reads out of Germany, the Eurozone, and UK, Canada manufacturing sales, and US initial jobless claims. We also get another round of testimony from the Fed Chair.USDCAD – technical overview
A recent surge back above 1.3000 signals an end to a period of bearish consolidation and suggests the market is in the process of carving out a more significant longer-term base. Next key resistance now comes in up into the 1.3500 area. Setbacks should be very well supported down into the 1.2500 area.USDCAD – fundamental overview
The Canadian Dollar remains under pressure despite this week's better than expected retail sales and hotter Canada inflation data. An intense pullback in the price of oil and ongoing risk off flow have been more than enough to offset positive flow. Key standouts on today’s calendar come from some PMI reads out of Germany, the Eurozone, and UK, Canada manufacturing sales, and US initial jobless claims. We also get another round of testimony from the Fed Chair.NZDUSD – technical overview
Overall pressure remains on the downside and conditions remain quite choppy. A break back above 0.6600 would be required to force a shift in the structure and suggest we are seeing a more significant bullish reversal. Until then, scope exists for fresh yearly lows and a retest of the 2015 low down towards 0.6100.NZDUSD – fundamental overview
Speculation over an RMB devaluation has been building and all of this worry has opened more downside pressure on risk assets, with Kiwi suffering as a consequence. Key standouts on today’s calendar come from some PMI reads out of Germany, the Eurozone, and UK, Canada manufacturing sales, and US initial jobless claims. We also get another round of testimony from the Fed Chair.US SPX 500 – technical overview
Longer-term technical studies are in the process of unwinding from extended readings off record highs. Look for rallies to be well capped in favor of lower tops and lower lows. Back above 4,206 will be required at a minimum to take the immediate pressure off the downside. Next major support comes in around 3,400.US SPX 500 – fundamental overview
With so little room for additional central bank accommodation, given an already depressed interest rate environment, the prospect for sustainable runs to the topside on easy money policy incentives and government stimulus, should no longer be as enticing to investors. Meanwhile, ongoing worry associated with rising inflation and slower growth should continue to weigh more heavily on investor sentiment in 2022.GOLD (SPOT) – technical overview
The 2019 breakout above the 2016 high at 1375 was a significant development, opening the door for fresh record highs. Setbacks should now be well supported above 1700.GOLD (SPOT) – fundamental overview
The yellow metal continues to be well supported on dips with solid demand from medium and longer-term accounts. These players are more concerned about exhausted monetary policy, extended global equities, and inflation risk. All of this should keep the commodity well supported, with many market participants also fleeing to the hard asset as the grand dichotomy of record high equities and record low yields comes to an unnerving climax.