


Today’s report: Another welcome wave of bad news
Investors are certainly getting what they want over the past couple of sessions. The Fed steered clear of a 100-basis point rate hike while communicating some messages that were perceived to be less hawkish leaning, and this was then followed up with a discouraging negative GDP print, putting the US economy into technical recession.
Wake-up call
- USD outflows
- 4-week high
- Fed repricing
- retail sales
- Canada GDP
- Local data
- Stocks vulnerable
- Dealers report
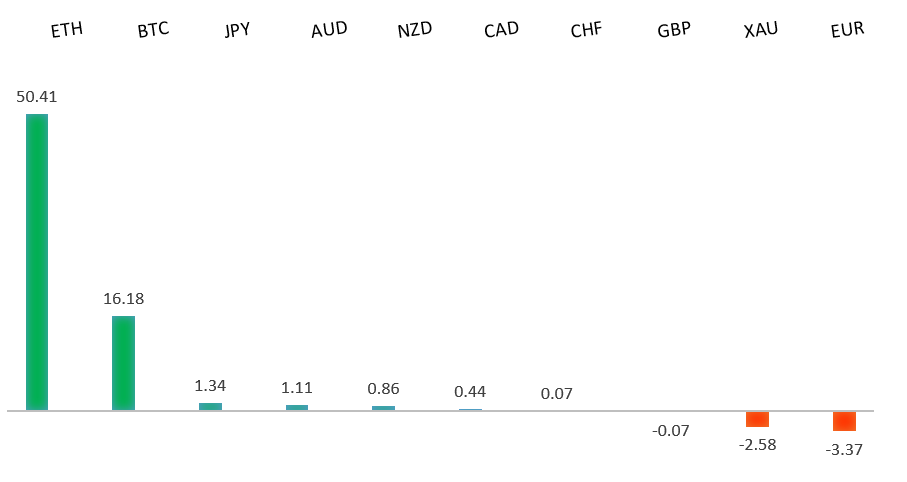
Peformance chart: 30 Day Performance vs. US dollar (%)
Suggested reading
- Are Commodity Markets on the Turn?, D. Fickling, Bloomberg (July 28, 2022)
- Can Green Carbon Help Heavy Industry?, S. Pfeifer, Financial Times (July 27, 2022)
Chart talk: Technical & fundamental highlights
Choose pair:
EURUSD – technical overview
The market has come under intense pressure in recent months, with setbacks accelerating below the critical multi-year low from 2017 at 1.0340. This sets up a test of monumental support in the form of parity. At the same time, technical studies are tracking in oversold territory, suggesting additional setbacks should be limited. Back above 1.0500 would be required to take the immediate pressure off the downside.EURUSD – fundamental overview
The Euro wasn't able to do much on Thursday, but was at least supported on broad based US Dollar selling post a softer US GDP read that resulted in scaled back Fed rate hike expectations. But economic data out of the Eurozone has been softer of late and there is plenty of worry about the outlook for the Eurozone economy that is keeping the single currency well offered into rallies. Key standouts on Friday’s calendar come from German employment, German GDP, BOE consumer credit, Eurozone GDP, Eurozone inflation, Canada GDP, US personal income and spending, US core PCE, Chicago PMIs, and Michigan sentiment.EURUSD - Technical charts in detail
GBPUSD – technical overview
The market continues to be exceptionally well supported on dips below 1.2000. Unless we see a monthly close below 1.2000, we expect this to continue to be the case. Look for a break back above 1.2200 to take the immediate pressure off the downside.GBPUSD – fundamental overview
There wasn't much to speak of on the UK side of things on Thursday. Instead, the day was all about a repricing of Fed rate expectations after US GDP disappointed. The resulting price action saw broad based US Dollar outflows, which proved to be a great benefit to the Pound. Key standouts on Friday’s calendar come from German employment, German GDP, BOE consumer credit, Eurozone GDP, Eurozone inflation, Canada GDP, US personal income and spending, US core PCE, Chicago PMIs, and Michigan sentiment.USDJPY – technical overview
Technical studies are in the process of unwinding, with scope for additional correction in the days and weeks ahead. Look for additional upside from here to be well capped. A break daily close back below 134.00 will take the immediate pressure off the topside.USDJPY – fundamental overview
We've seen some demand for the Yen in recent sessions. Most of this price action comes from position adjusting from shorter-term accounts following a massive decline in the Yen. There has also been a round of position adjusting in favor of the Yen as the market reprices Fed rate hike expectations in the aftermath of this week's FOMC decision and softer US GDP. Key standouts on Friday’s calendar come from German employment, German GDP, BOE consumer credit, Eurozone GDP, Eurozone inflation, Canada GDP, US personal income and spending, US core PCE, Chicago PMIs, and Michigan sentiment.AUDUSD – technical overview
Overall pressure remains on the downside and conditions remain quite choppy. A break back above 0.7070 would be required at a minimum to take the immediate pressure off the downside. Until then, scope exists for deeper setbacks towards 0.6500.AUDUSD – fundamental overview
The Australian Dollar took an early hit on Thursday from a softer than expected Aussie retail sales print, but managed to recover in the North American session on broad based US Dollar outflows after US GDP came in soft, forcing a repricing of Fed expectations. Key standouts on Friday’s calendar come from German employment, German GDP, BOE consumer credit, Eurozone GDP, Eurozone inflation, Canada GDP, US personal income and spending, US core PCE, Chicago PMIs, and Michigan sentiment.USDCAD – technical overview
A recent surge back above 1.3000 signals an end to a period of bearish consolidation and suggests the market is in the process of carving out a more significant longer-term base. Next key resistance now comes in up into the 1.3500 area. Setbacks should be very well supported down into the 1.2500 area.USDCAD – fundamental overview
Massive US Dollar outflows post Fed decision and softer US GDP have resulted in demand for the Canadian Dollar. Stocks higher have also contributed to the Loonie upside. Key standouts on Friday’s calendar come from German employment, German GDP, BOE consumer credit, Eurozone GDP, Eurozone inflation, Canada GDP, US personal income and spending, US core PCE, Chicago PMIs, and Michigan sentiment.NZDUSD – technical overview
Overall pressure remains on the downside and conditions remain quite choppy. A break back above 0.6400 would be required to force a shift in the structure and suggest we are seeing a more significant bullish reversal. Until then, scope exists for fresh yearly lows and a retest of the major psychological barrier at 0.6000.NZDUSD – fundamental overview
The New Zealand Dollar has been better bid of late, getting help from US Dollar outflows and a US equities recovery post FOMC decision and softer US GDP. We've also seen demand from better than expected New Zealand data in the form of business confidence and the activity outlook. Key standouts on Friday’s calendar come from German employment, German GDP, BOE consumer credit, Eurozone GDP, Eurozone inflation, Canada GDP, US personal income and spending, US core PCE, Chicago PMIs, and Michigan sentiment.US SPX 500 – technical overview
Longer-term technical studies are in the process of unwinding from extended readings off record highs. Look for rallies to be well capped in favor of lower tops and lower lows. Back above 4,206 will be required at a minimum to take the immediate pressure off the downside. Next major support comes in around 3,400.US SPX 500 – fundamental overview
We've finally reached a point in the cycle where the Fed recognizes unanchored inflation expectations pose a greater downside risk than over-tightening. This is significant, as it means less investor friendly monetary policy that risks potential recession in the months ahead. And so, naturally, stocks have been under intense pressure in 2022.GOLD (SPOT) – technical overview
The 2019 breakout above the 2016 high at 1375 was a significant development, opening the door for fresh record highs. Setbacks should now be well supported above 1700 on a monthly close basis.GOLD (SPOT) – fundamental overview
The yellow metal continues to be well supported on dips with solid demand from medium and longer-term accounts. These players are more concerned about inflation risk and a less upbeat global growth outlook. All of this should keep the commodity well supported, with many market participants also fleeing to the hard asset as the grand dichotomy of record high equities and record low yields comes to an unnerving climax.