


Next 24 hours: Choppy directionless trade
Today’s report: Hawkish Fed speak revives the Buck
The US Dollar made a strong comeback in Tuesday trade, this mostly driven by a wave of hawkish Fed speak from the likes of Mester, Evans, and Daly. We didn’t see much from US equities, though what we did see was risk off in nature, with stocks closing lower on the day.
Wake-up call
- producer prices
- BOE week
- worry unwound
- dovish RBA
- PMIs slide
- stocks retreat
- Stocks vulnerable
- Dealers report
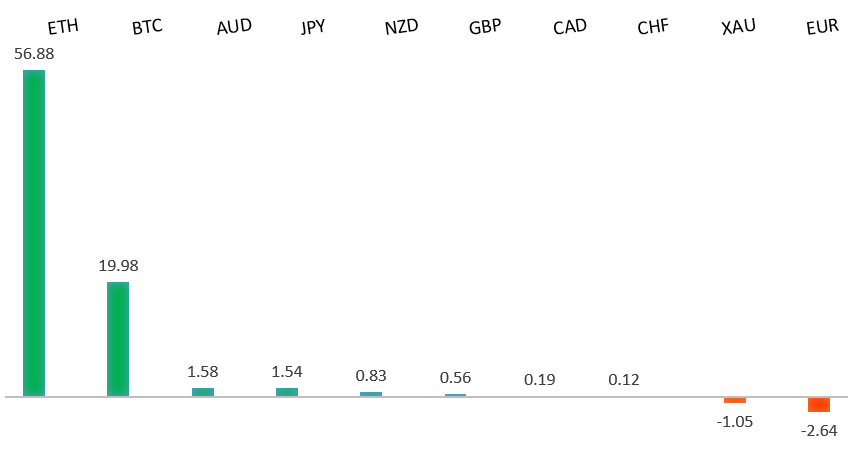
Peformance chart: 30 Day Performance vs. US dollar (%)
Suggested reading
- Far Too Risky to Assume That the Bottom Is In, J. Authers, Bloomberg (August 2, 2022)
- Nuclear is Bouncing Back, M. McCormick, FT (August 1, 2022)
Chart talk: Technical & fundamental highlights
Choose pair:
EURUSD – technical overview
The market has come under intense pressure in recent months, with setbacks accelerating below the critical multi-year low from 2017 at 1.0340. This sets up a test of monumental support in the form of parity. At the same time, technical studies are tracking in oversold territory, suggesting additional setbacks should be limited. Back above 1.0500 would be required to take the immediate pressure off the downside.EURUSD – fundamental overview
Not a lot of color out of the Eurozone on Tuesday, with most of the price action centered around US dollar demand from a wave of hawkish Fed speak. Key standouts on Wednesday’s calendar come in the form of German trade, German, Eurozone, and UK PMI reads, Eurozone retail sales, Eurozone producer prices, US ISM non-manufacturing, and US factory orders.EURUSD - Technical charts in detail
GBPUSD – technical overview
The market continues to be exceptionally well supported on dips below 1.2000. Unless we see a monthly close below 1.2000, we expect this to continue to be the case. Look for this latest break back above 1.2200 to strengthen the case for the establishment of a meaningful base.GBPUSD – fundamental overview
UK Nationwide house prices rose, but missed forecasts, which may have weighed on the Pound a bit. Ultimately however, the Pound was weighed down on Monday from a wave of hawkish speak from a number of Fed officials. Key standouts on Wednesday’s calendar come in the form of German trade, German, Eurozone, and UK PMI reads, Eurozone retail sales, Eurozone producer prices, US ISM non-manufacturing, and US factory orders.USDJPY – technical overview
Technical studies are in the process of unwinding, with scope for additional correction in the days and weeks ahead. Look for additional upside from here to be well capped. Next key support comes in at 130.00.USDJPY – fundamental overview
Tuesday was a wild day for the Yen, which initially extended its run of gains on early USD selling and nervous tension between the US and China. But after the House Speaker arrived in Taiwan without incident, and after we got a wave of hawkish Fed speak from a number of Fed officials, we saw a sharp reversal back in favor of the Buck. Key standouts on Wednesday’s calendar come in the form of German trade, German, Eurozone, and UK PMI reads, Eurozone retail sales, Eurozone producer prices, US ISM non-manufacturing, and US factory orders.AUDUSD – technical overview
Overall pressure remains on the downside and conditions remain quite choppy. A break back above 0.7070 would be required at a minimum to take the immediate pressure off the downside. Until then, scope exists for deeper setbacks towards 0.6500.AUDUSD – fundamental overview
The Australian Dollar gave up quite a bit of ground on Tuesday. Initially, it was the dovish communication from the RBA decision that inspired a reversal of flow. Then, it was a wave of hawkish Fed speak, which opened more broad based selling of currencies in favor of the US Dollar. Key standouts on Wednesday’s calendar come in the form of German trade, German, Eurozone, and UK PMI reads, Eurozone retail sales, Eurozone producer prices, US ISM non-manufacturing, and US factory orders.USDCAD – technical overview
A recent surge back above 1.3000 signals an end to a period of bearish consolidation and suggests the market is in the process of carving out a more significant longer-term base. Next key resistance now comes in up into the 1.3500 area. Setbacks should be very well supported down into the 1.2500 area.USDCAD – fundamental overview
Canada manufacturing PMIs for July slid to 52.5, compared to the 54.6 print in June. This was the lowest print since June 2020 and opened more downside pressure in the Loonie. We also saw broad based selling of currencies in favor of the Buck on a hawkish round of Fed speak. Key standouts on Wednesday’s calendar come in the form of German trade, German, Eurozone, and UK PMI reads, Eurozone retail sales, Eurozone producer prices, US ISM non-manufacturing, and US factory orders.NZDUSD – technical overview
Overall pressure remains on the downside and conditions remain quite choppy. A break back above 0.6400 would be required to force a shift in the structure and suggest we are seeing a more significant bullish reversal. Until then, scope exists for fresh yearly lows and a retest of the major psychological barrier at 0.6000.NZDUSD – fundamental overview
The New Zealand Dollar was under intense pressure on Tuesday, this after the market was back to buying US Dollars on a wave of hawkish Fed speak. We also saw some downside pressure associated with the pullback in US equities. Key standouts on Wednesday’s calendar come in the form of German trade, German, Eurozone, and UK PMI reads, Eurozone retail sales, Eurozone producer prices, US ISM non-manufacturing, and US factory orders.US SPX 500 – technical overview
Longer-term technical studies are in the process of unwinding from extended readings off record highs. Look for rallies to be well capped in favor of lower tops and lower lows. Back above 4,206 will be required at a minimum to take the immediate pressure off the downside. Next major support comes in around 3,400.US SPX 500 – fundamental overview
We've finally reached a point in the cycle where the Fed recognizes unanchored inflation expectations pose a greater downside risk than over-tightening. This is significant, as it means less investor friendly monetary policy that risks potential recession in the months ahead. And so, naturally, stocks have been under intense pressure in 2022.GOLD (SPOT) – technical overview
The 2019 breakout above the 2016 high at 1375 was a significant development, opening the door for fresh record highs. Setbacks should now be well supported above 1700 on a monthly close basis.GOLD (SPOT) – fundamental overview
The yellow metal continues to be well supported on dips with solid demand from medium and longer-term accounts. These players are more concerned about inflation risk and a less upbeat global growth outlook. All of this should keep the commodity well supported, with many market participants also fleeing to the hard asset as the grand dichotomy of record high equities and record low yields comes to an unnerving climax.