


Special report: BOE decision preview
Today’s report: Stocks race higher despite hawkish Fed speak
Another day, another round of hawkish Fed speak, this time starring Bullard, Daly, and Kashkari. This hawkish round of Fed speak was also accompanied by healthy US economic data.
Wake-up call
- Encouraging data
- BOE decision
- hawkish Fed
- retail sales
- lower oil
- risk sentiment
- Stocks vulnerable
- Dealers report
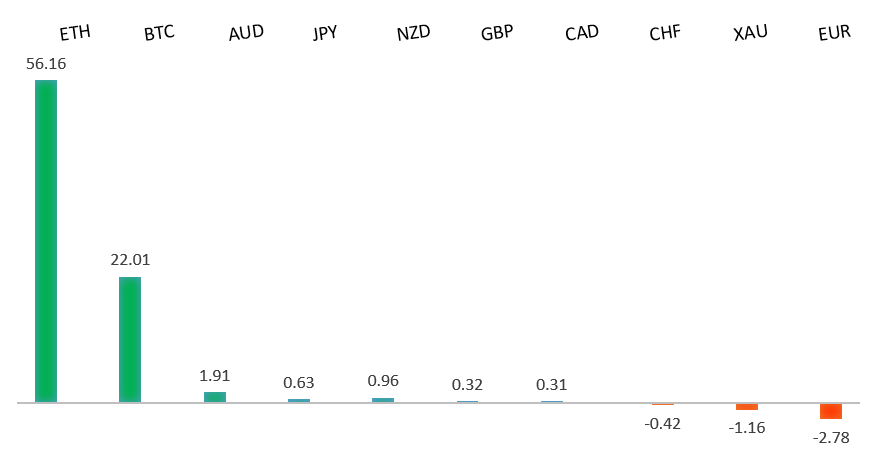
Peformance chart: 30 Day Performance vs. US dollar (%)
Suggested reading
- Corporate Bond Market Didn’t Get the Recession Memo, J. Authers, Bloomberg (August 3, 2022)
- Nuclear is Bouncing Back, M. McCormick, FT (August 1, 2022)
Chart talk: Technical & fundamental highlights
Choose pair:
EURUSD – technical overview
The market has come under intense pressure in recent months, with setbacks accelerating below the critical multi-year low from 2017 at 1.0340. This sets up a test of monumental support in the form of parity. At the same time, technical studies are tracking in oversold territory, suggesting additional setbacks should be limited. Back above 1.0500 would be required to take the immediate pressure off the downside.EURUSD – fundamental overview
Economic data out of the Eurozone was encouraging on Wednesday. German exports rose by an impressive amount, while Eurozone services and composite reads were also solid. But none of this had much influence on the Euro, will the single currency trading flat on the day. Key standouts on Thursday’s calendar come from German factory orders, Eurozone, German, and UK construction PMIs, the BOE policy decision, Canada trade, US trade, and US initial jobless claims.EURUSD - Technical charts in detail
GBPUSD – technical overview
The market continues to be exceptionally well supported on dips below 1.2000. Unless we see a monthly close below 1.2000, we expect this to continue to be the case. Look for this latest break back above 1.2200 to strengthen the case for the establishment of a meaningful base.GBPUSD – fundamental overview
UK PMI reads came in a little softer on Wednesday, while NIESR was out warning that millions of UK households would lose their savings due to the cost-of-living crisis, unless the government increased support for households immediately. The Pound was a little softer on the day, but held up into dips on positioning into today's BOE event risk. Key standouts on Thursday’s calendar come from German factory orders, Eurozone, German, and UK construction PMIs, the BOE policy decision, Canada trade, US trade, and US initial jobless claims.USDJPY – technical overview
Technical studies are in the process of unwinding, with scope for additional correction in the days and weeks ahead. Look for additional upside from here to be well capped. Next key support comes in at 130.00.USDJPY – fundamental overview
We've seen attempts at renewed selling in the Yen, after the currency had seen a multi-session recovery. Dollar demand from the combination of higher stocks and hawkish Fed speak, seemed to be behind the latest run of declines in the Yen. Key standouts on Thursday’s calendar come from German factory orders, Eurozone, German, and UK construction PMIs, the BOE policy decision, Canada trade, US trade, and US initial jobless claims.AUDUSD – technical overview
Overall pressure remains on the downside and conditions remain quite choppy. A break back above 0.7070 would be required at a minimum to take the immediate pressure off the downside. Until then, scope exists for deeper setbacks towards 0.6500.AUDUSD – fundamental overview
The Australian Dollar recovered in Wednesday trade, getting a boost from solid Aussie PMI reads, better than expected Aussie retail sales, and another run higher in US equities. Key standouts on Thursday’s calendar come from German factory orders, Eurozone, German, and UK construction PMIs, the BOE policy decision, Canada trade, US trade, and US initial jobless claims.USDCAD – technical overview
A recent surge back above 1.3000 signals an end to a period of bearish consolidation and suggests the market is in the process of carving out a more significant longer-term base. Next key resistance now comes in up into the 1.3500 area. Setbacks should be very well supported down into the 1.2500 area.USDCAD – fundamental overview
The Canadian Dollar traded higher on Wednesday, this despite downside price action in oil. It seems broad pressure on the US Dollar and another push higher in US equities more than offset. Key standouts on Thursday’s calendar come from German factory orders, Eurozone, German, and UK construction PMIs, the BOE policy decision, Canada trade, US trade, and US initial jobless claims.NZDUSD – technical overview
Overall pressure remains on the downside and conditions remain quite choppy. A break back above 0.6400 would be required to force a shift in the structure and suggest we are seeing a more significant bullish reversal. Until then, scope exists for fresh yearly lows and a retest of the major psychological barrier at 0.6000.NZDUSD – fundamental overview
The New Zealand Dollar was initially weighed down in early Wednesday trade on the news of the rise in the New Zealand jobless rate, but managed to recover through the day on broad US Dollar selling and additional demand for US equities. Key standouts on Thursday’s calendar come from German factory orders, Eurozone, German, and UK construction PMIs, the BOE policy decision, Canada trade, US trade, and US initial jobless claims.US SPX 500 – technical overview
Longer-term technical studies are in the process of unwinding from extended readings off record highs. Look for rallies to be well capped in favor of lower tops and lower lows. Back above 4,206 will be required at a minimum to take the immediate pressure off the downside. Next major support comes in around 3,400.US SPX 500 – fundamental overview
We've finally reached a point in the cycle where the Fed recognizes unanchored inflation expectations pose a greater downside risk than over-tightening. This is significant, as it means less investor friendly monetary policy that risks potential recession in the months ahead. And so, naturally, stocks have been under intense pressure in 2022.GOLD (SPOT) – technical overview
The 2019 breakout above the 2016 high at 1375 was a significant development, opening the door for fresh record highs. Setbacks should now be well supported above 1700 on a monthly close basis.GOLD (SPOT) – fundamental overview
The yellow metal continues to be well supported on dips with solid demand from medium and longer-term accounts. These players are more concerned about inflation risk and a less upbeat global growth outlook. All of this should keep the commodity well supported, with many market participants also fleeing to the hard asset as the grand dichotomy of record high equities and record low yields comes to an unnerving climax.