


Next 24 hours: China outlook sours and brings down markets
Today’s report: Why the risk on run could be a trap
We think investors need to be very careful heading into this new week. We’ve seen a lot of renewed optimism in recent weeks, with stocks rallying aggressively higher and the US Dollar selling off. All of this on a repricing of Fed rate hike expectations, with the market now believing the Fed will start to ease up.
Wake-up call
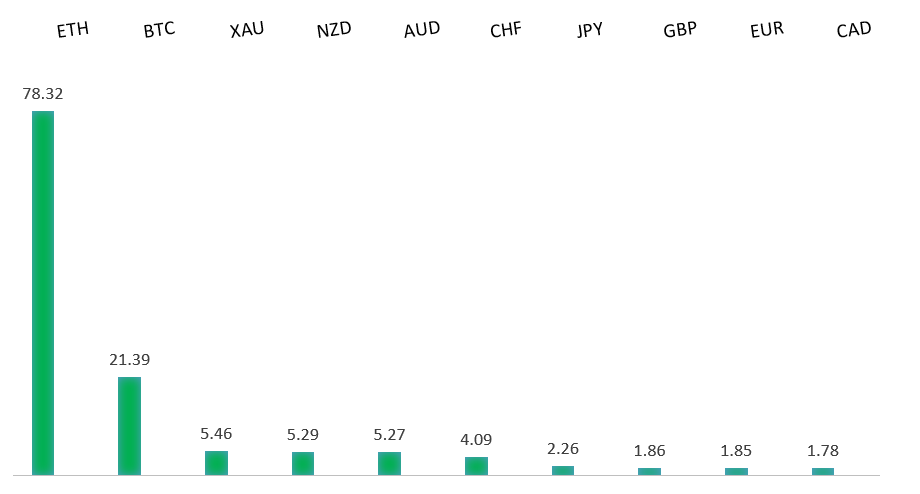
Peformance chart: 30 Day Performance vs. US dollar (%)
Suggested reading
- Will Housing Prices Flatten — or Collapse?, J. Levin, Bloomberg (August 14, 2022)
- Can e-bikes Transform our Cities?, H. Dempsey, Financial Times (August 7, 2022)
Chart talk: Technical & fundamental highlights
Choose pair:
EURUSD – technical overview
The market has come under intense pressure in recent months, with setbacks accelerating below the critical multi-year low from 2017 at 1.0340. This sets up a test of monumental support in the form of parity. At the same time, technical studies are tracking in oversold territory, suggesting additional setbacks should be limited. Back above 1.0500 would be required to take the immediate pressure off the downside.EURUSD – fundamental overview
The Euro had come under pressure to close out the previous week. Energy crisis headlines seemed to be the driving force behind the weakness. French and German year-ahead electricity prices have surged to record highs. Key standouts on Monday’s calendar come from German wholesale prices, Canada manufacturing sales, US NY empire state manufacturing, and US NAHB housing.EURUSD - Technical charts in detail
GBPUSD – technical overview
The market continues to be exceptionally well supported on dips below 1.2000. Unless we see a monthly close below 1.2000, we expect this to continue to be the case. Look for this latest break back above 1.2200 to strengthen the case for the establishment of a meaningful base.GBPUSD – fundamental overview
The Pound came under pressure this past Friday on the back of negative UK GDP and industrial production prints. GBP sentiment has also been weighed down by energy crisis concerns, with consumption power bills set to rise 80%. A drought has now been declared in a majority of England. Key standouts on Monday’s calendar come from German wholesale prices, Canada manufacturing sales, US NY empire state manufacturing, and US NAHB housing.USDJPY – technical overview
Technical studies are in the process of unwinding, with scope for additional correction in the days and weeks ahead. Look for additional upside from here to be well capped. Next key support comes in at 130.00.USDJPY – fundamental overview
Most of what we've been seeing here is a shift in demand, with the intense selling of the Yen that we had seen earlier this year fading away, in favor of some consolidation and renewed demand for the Yen. A lot of this has been driven off broad based US Dollar outflows. Interestingly enough, all of this risk on flow and rally in US equities, has done nothing to weaken the Yen. This reflects a currency that has already been hit so hard that the correlation with stocks is less relevant these days. Key standouts on Monday’s calendar come from German wholesale prices, Canada manufacturing sales, US NY empire state manufacturing, and US NAHB housing.AUDUSD – technical overview
Overall pressure remains on the downside despite the recent recovery and conditions remain quite choppy. A break back above 0.7284 would be required to take the pressure off the downside. Until then, scope exists for a lower top below 0.7284 and deeper setbacks towards 0.6500.AUDUSD – fundamental overview
The recovery we've been seeing in the Australian Dollar is directly tied to a rebound in stocks and resurgence in demand for gold. Key standouts on Monday’s calendar come from German wholesale prices, Canada manufacturing sales, US NY empire state manufacturing, and US NAHB housing.USDCAD – technical overview
A recent surge back above 1.3000 signals an end to a period of bearish consolidation and suggests the market is in the process of carving out a more significant longer-term base. Next key resistance now comes in up into the 1.3500 area. Setbacks should be very well supported down into the 1.2500 area.USDCAD – fundamental overview
The Canadian Dollar came back under some pressure on Friday, with the currency mostly suffering from the weakness in oil. Key standouts on Monday’s calendar come from German wholesale prices, Canada manufacturing sales, US NY empire state manufacturing, and US NAHB housing.NZDUSD – technical overview
Overall pressure remains on the downside despite the recent recovery and conditions remain quite choppy. A break back above 0.6577 would be required to take the pressure off the downside. Until then, scope exists for a lower top below 0.6577 and deeper setbacks below 0.6000.NZDUSD – fundamental overview
The New Zealand Dollar has been well bid of late, with the currency mostly supported on bigger picture themes and broad based US Dollar outflow. We've also seen some demand into this week's RBNZ event risk, where a 50 basis point rate hike is widely expected. Key standouts on Monday’s calendar come from German wholesale prices, Canada manufacturing sales, US NY empire state manufacturing, and US NAHB housing.US SPX 500 – technical overview
Longer-term technical studies are in the process of unwinding from extended readings off record highs. Look for rallies to be well capped in favor of lower tops and lower lows. Back above 4,310 will be required at a minimum to take the immediate pressure off the downside. Next major support comes in around 3,400.US SPX 500 – fundamental overview
We've finally reached a point in the cycle where the Fed recognizes unanchored inflation expectations pose a greater downside risk than over-tightening. This is significant, as it means less investor friendly monetary policy that risks potential recession in the months ahead. We have seen an attempt at recovery in recent weeks, with softer CPI reads helping. But overall, we expect inflation to continue to be a problem that results in renewed downside pressure into rallies.GOLD (SPOT) – technical overview
The 2019 breakout above the 2016 high at 1375 was a significant development, opening the door for fresh record highs. Setbacks should now be well supported above 1700 on a monthly close basis.GOLD (SPOT) – fundamental overview
The yellow metal continues to be well supported on dips with solid demand from medium and longer-term accounts. These players are more concerned about inflation risk and a less upbeat global growth outlook. All of this should keep the commodity well supported, with many market participants also fleeing to the hard asset as the grand dichotomy of record high equities and record low yields comes to an unnerving climax.