


Next 24 hours: August comes to a close
Today’s report: Healthy chunk of data on Wednesday calendar
US rates have pushed up to fresh highs and the market continues to stumble in the aftermath of Jackson Hole, with the S&P500 sinking back below 4k and the US Dollar remaining well in demand.
Wake-up call
- price cap
- Goldman, Citi
- surging inflation
- dealers report
- Canada GDP
- risk-off flow
- Inflation headache
- Dealers report
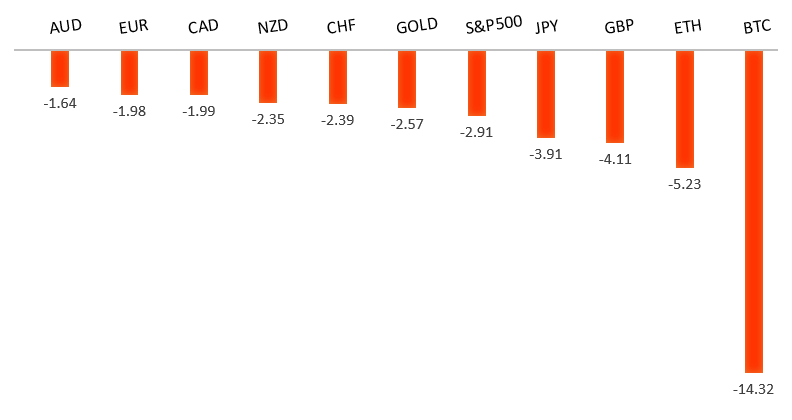
Peformance chart: 30 Day Performance vs. US dollar (%)
Suggested reading
- Junk Bond Traders Ought to Check In With Economists, J. Levin, Bloomberg (August 30, 2022)
- Nuclear Is Back In Vogue - What About Its Waste?, A. Gross, Financial Times (August 31, 2022)
Chart talk: Technical & fundamental highlights
Choose pair:
EURUSD – technical overview
The market has come under intense pressure in recent months, with setbacks accelerating below the critical multi-year low from 2017 at 1.0340. This has set up a dip below monumental support in the form of parity. At the same time, technical studies are tracking in oversold territory, suggesting additional setbacks should be limited. Back above 1.0500 would be required to take the immediate pressure off the downside.EURUSD – fundamental overview
Enthusiasm around the EU gas price cap plan has faded, mostly as market participants comes to terms with the reality that you can print money but you can't print gas. Still, with the ECB talking a lot more hawkish and with German inflation rising to a record 8.8%, the Euro has been better bid in recent sessions. Key standouts on Wednesday’s calendar include German unemployment, Eurozone inflation, US ADP employment, a Fed Mester speech, Canada GDP, and Chicago PMIs.EURUSD - Technical charts in detail
GBPUSD – technical overview
The market continues to be exceptionally well supported on dips below 1.2000. Unless we see a monthly close below 1.2000, we expect this to continue to be the case. Next key support comes in at the multi-year low from 2020 in the 1.1400 area. Look for a push back above 1.1900 to take the immediate pressure off the downside.GBPUSD – fundamental overview
The Pound has recovered off the fresh yearly and multi-month low from Tuesday, getting help from broad based profit taking on US Dollar longs into Wednesday. The UK currency had taken an added hit after Goldman Sachs followed up Citi with its own downbeat forecast for the UK economy. Key standouts on Wednesday’s calendar include German unemployment, Eurozone inflation, US ADP employment, a Fed Mester speech, Canada GDP, and Chicago PMIs.USDJPY – technical overview
Technical studies are looking quite stretched on the longer-term chart, warning of consolidation and correction in the days and weeks ahead. Look for additional upside from here to be well capped into the 140.00 area. Next key support comes in at 135.81.USDJPY – fundamental overview
As much as the Yen has been sold of late on the intensely favorable US Dollar yield differential, the currency has at least managed to avoid extending fresh multi-year declines against the Buck. It seems rocketing inflation in Japan has been difficult for even the BOJ to ignore, something that could at least force policy that is somewhat less accommodative than what we've come to see from the central bank. Key standouts on Wednesday’s calendar include German unemployment, Eurozone inflation, US ADP employment, a Fed Mester speech, Canada GDP, and Chicago PMIs.AUDUSD – technical overview
Overall pressure remains on the downside despite the recent recovery and conditions remain quite choppy. A break back above 0.7137 would be required to take the pressure off the downside. Until then, scope exists for a lower top below 0.7284 and deeper setbacks towards 0.6500.AUDUSD – fundamental overview
The Australian Dollar has done a good job holding up into the latest bout of risk off flow, getting help from Monday's much better than expected Aussie retail sales print and today's solid China manufacturing PMI reads. Nevertheless, with US stocks under pressure and this latest Aussie housing data coming in soft, we continue to see the currency well offered into rallies. We also saw some stability in risk markets on Monday, which proved to be an additional prop for the currency. Key standouts on Wednesday’s calendar include German unemployment, Eurozone inflation, US ADP employment, a Fed Mester speech, Canada GDP, and Chicago PMIs.USDCAD – technical overview
A recent surge back above 1.3000 signals an end to a period of bearish consolidation and suggests the market is in the process of carving out a more significant longer-term base. Next key resistance now comes in up into the 1.3500 area. Setbacks should be very well supported down into the 1.2500 area.USDCAD – fundamental overview
An intense pullback in the price of oil and more downside in US equities have rocked the Canadian Dollar to its lowest levels in 6 weeks. Key standouts on Wednesday’s calendar include German unemployment, Eurozone inflation, US ADP employment, a Fed Mester speech, Canada GDP, and Chicago PMIs.NZDUSD – technical overview
Overall pressure remains on the downside despite the recent recovery and conditions remain quite choppy. A break back above 0.6469 would be required to take the pressure off the downside. Until then, scope exists for a lower top below 0.6577 and deeper setbacks below 0.6000.NZDUSD – fundamental overview
The New Zealand Dollar continues to struggle with risk off flow in global markets and should continue to play off the bigger picture themes as far as the outlook for the currency goes. Key standouts on Wednesday’s calendar include German unemployment, Eurozone inflation, US ADP employment, a Fed Mester speech, Canada GDP, and Chicago PMIs.US SPX 500 – technical overview
Longer-term technical studies are in the process of unwinding from extended readings off record highs. Look for rallies to be well capped in favor of lower tops and lower lows. Back above 4,500 will be required at a minimum to take the immediate pressure off the downside. Next major support comes in around 3,400.US SPX 500 – fundamental overview
We've finally reached a point in the cycle where the Fed recognizes unanchored inflation expectations pose a greater downside risk than over-tightening. This is significant, as it means less investor friendly monetary policy that risks potential recession in the months ahead. We have seen an attempt at recovery in recent weeks, with softer CPI reads helping. But overall, we expect inflation to continue to be a problem that results in renewed downside pressure into rallies.GOLD (SPOT) – technical overview
The 2019 breakout above the 2016 high at 1375 was a significant development, opening the door for fresh record highs. Setbacks should now be well supported above 1700 on a monthly close basis.GOLD (SPOT) – fundamental overview
The yellow metal continues to be well supported on dips with solid demand from medium and longer-term accounts. These players are more concerned about inflation risk and a less upbeat global growth outlook. All of this should keep the commodity well supported, with many market participants also fleeing to the hard asset as the grand dichotomy of record high equities and record low yields comes to an unnerving climax.