


Next 24 hours: Yen slammed to fresh multi-year low
Today’s report: China continues to make moves
We expect market activity to ramp up as the US market returns from the long weekend break and as we officially transition from the summer months. There has been some attention on Tuesday around more efforts out of China to stimulate the economy.
Wake-up call
- downside risk
- Liz Truss
- FinMin Suzuki
- RBA decision
- Dreadful data
- macro outlook
- Inflation headache
- Dealers report
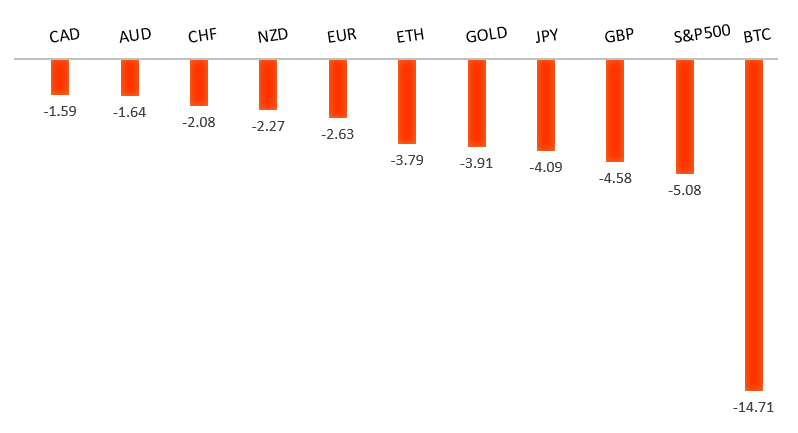
Peformance chart: 30 Day Performance vs. US dollar (%)
Suggested reading
- Did the Fed Get It Right After All?, E. Mollo, Bloomberg (September 3, 2022)
- Food and Fuel Compete for Farmland, E. Terazono, Financial Times (September 5, 2022)
Chart talk: Technical & fundamental highlights
Choose pair:
EURUSD – technical overview
The market has come under intense pressure in recent months, with setbacks accelerating below the critical multi-year low from 2017 at 1.0340. This has set up a dip below monumental support in the form of parity. At the same time, technical studies are tracking in oversold territory, suggesting additional setbacks should be limited. Back above 1.0500 would be required to take the immediate pressure off the downside.EURUSD – fundamental overview
The Euro extended to a fresh yearly and multi-year low in some very thin Monday holiday trade. But we did see some profit taking into the end of the day and with so much downside priced in around monetary policy divergence and the energy crisis, it's possible we're getting closer to a reversal. Key standouts on Tuesday’s calendar come from Eurozone, German, and UK construction PMIs, and US ISM non-manufacturing.EURUSD - Technical charts in detail
GBPUSD – technical overview
The market continues to be exceptionally well supported on dips below 1.2000. At the same time, there is now risk for a retest of the multi-year low from 2020 down in the 1.1400 area before we see the formation of a base and the next big push back through 1.2000. Back above 1.1761 takes the immediate pressure off the downside.GBPUSD – fundamental overview
The Pound is trying to find a bottom and got some support in a US holiday thin Monday session from the confirmation news of Liz Truss securing the UK Conservative party leadership and becoming the next PM. Key standouts on Tuesday’s calendar come from Eurozone, German, and UK construction PMIs, and US ISM non-manufacturing.USDJPY – technical overview
Technical studies are looking quite stretched on the longer-term chart, warning of consolidation and correction in the days and weeks ahead. Look for additional upside from here to be well capped into the 140.00 area. Next key support comes in at 135.81.USDJPY – fundamental overview
Yield differentials between the Yen and US Dollar have resulted in a massive downturn in the Yen in 2022, with the currency at its lowest levels since 1998. Monetary policy divergence will continue to drive flow here, especially with the BOJ still not willing to rule out additional easing. Recent attempts by Japan FinMin Suzuki to stop the bleed haven't helped much, after saying sudden FX moves not desirable. Key standouts on Tuesday’s calendar come from Eurozone, German, and UK construction PMIs, and US ISM non-manufacturing.AUDUSD – technical overview
Overall pressure remains on the downside despite the recent recovery and conditions remain quite choppy. A break back above 0.7137 would be required to take the pressure off the downside. Until then, scope exists for a lower top below 0.7284 and deeper setbacks towards 0.6500.AUDUSD – fundamental overview
The Australian Dollar hasn't been able to avoid the dangers associated with high-beta currencies as risk off flow dominates the headlines. Having said that, we are seeing attempts for the currency to stabilize as the market takes in today's Aussie data and central bank event risk. The RBA hiked rates 50 basis points as widely expected, leaving little room for post-event risk volatility. Key standouts on Tuesday’s calendar come from Eurozone, German, and UK construction PMIs, and US ISM non-manufacturing.USDCAD – technical overview
A recent surge back above 1.3000 signals an end to a period of bearish consolidation and suggests the market is in the process of carving out a more significant longer-term base. Next key resistance now comes in up into the 1.3500 area. Setbacks should be very well supported down into the 1.2500 area.USDCAD – fundamental overview
More bleed for the Canadian Dollar last week after economic data out of Canada was awful. Meanwhile, stocks continued to tumble and oil remained under pressure. The Bank of Canada is expected to raise rates by 75 basis points on Wednesday. Key standouts on Tuesday’s calendar come from Eurozone, German, and UK construction PMIs, and US ISM non-manufacturing.NZDUSD – technical overview
Overall pressure remains on the downside despite the recent recovery and conditions remain quite choppy. A break back above 0.6251 would be required to take the pressure off the downside. Until then, scope exists for deeper setbacks below 0.6000.NZDUSD – fundamental overview
The New Zealand Dollar continues to struggle with risk off flow in global markets and should continue to play off the bigger picture themes as far as the outlook for the currency goes. Key standouts on Tuesday’s calendar come from Eurozone, German, and UK construction PMIs, and US ISM non-manufacturing.US SPX 500 – technical overview
Longer-term technical studies are in the process of unwinding from extended readings off record highs. Look for rallies to be well capped in favor of lower tops and lower lows. Back above 4,328 will be required at a minimum to take the immediate pressure off the downside. Next major support comes in around 3,400.US SPX 500 – fundamental overview
We've finally reached a point in the cycle where the Fed recognizes unanchored inflation expectations pose a greater downside risk than over-tightening. This is significant, as it means less investor friendly monetary policy that risks potential recession in the months ahead. We have seen an attempt at recovery in recent weeks, with softer CPI reads helping. But overall, we expect inflation to continue to be a problem that results in renewed downside pressure into rallies.GOLD (SPOT) – technical overview
The 2019 breakout above the 2016 high at 1375 was a significant development, opening the door for fresh record highs. Setbacks should now be well supported above 1700 on a monthly close basis.GOLD (SPOT) – fundamental overview
The yellow metal continues to be well supported on dips with solid demand from medium and longer-term accounts. These players are more concerned about inflation risk and a less upbeat global growth outlook. All of this should keep the commodity well supported, with many market participants also fleeing to the hard asset as the grand dichotomy of record high equities and record low yields comes to an unnerving climax.