


Next 24 hours: Pound rallies on government tax u-turn
Today’s report: Will things be different in Q4 2022?
US equities haven’t been able to find a bottom and while we have seen some profit taking on US Dollar longs, the trend is still very much pointing in the Buck’s direction.
Wake-up call
- Russia annex
- PM sticks
- still weak
- credit growth
- Economic data
- macro themes
- Inflation headache
- Dealers report
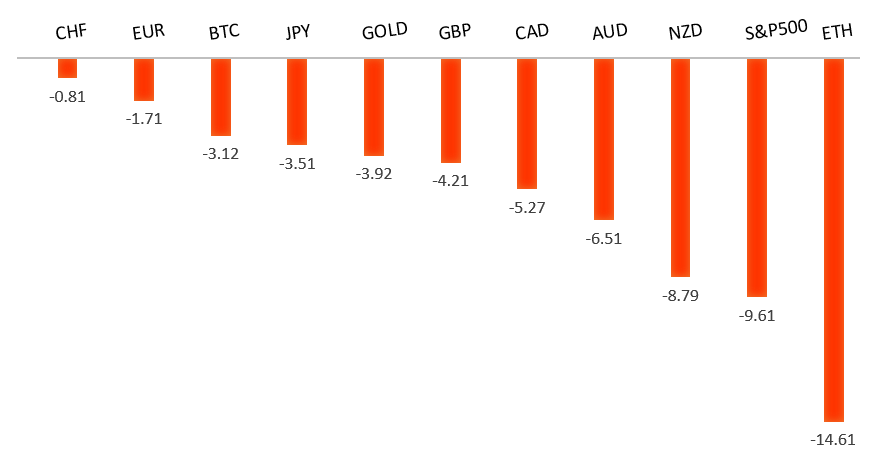
Peformance chart: 30 Day Performance vs. US dollar (%)
Suggested reading
- Oil Output Cut Will Underwhelm Without a Big Change, J. Lee, Bloomberg (October 2, 2022)
- UK Business Needs Long-Term Policies and Stability, T. Hayward, Financial Times (October 3, 2022)
Chart talk: Technical & fundamental highlights
Choose pair:
EURUSD – technical overview
The market has come under intense pressure in recent months, with setbacks accelerating below parity. The next major support level comes in the form of the psychological barrier at 0.9000. At the same time, technical studies are turning up from oversold territory, suggesting additional setbacks should be limited in favour of some form of a meaningful base. Back above parity will take the immediate pressure off the downside.EURUSD – fundamental overview
The Euro came back under pressure Friday after Russia annexed four Ukraine regions. And with no end to the war in sight, the single currency has been feeling a little more depressed. Key standouts on Monday’s calendar come from German, Eurozone, UK, Canada, and US PMI reads, US construction spending, and some Fed speak.EURUSD - Technical charts in detail
GBPUSD – technical overview
The downtrend has been intense, with the market collapsing to a fresh record low after taking out the previous record low from 1985 earlier this week. The next major barrier below comes in at parity, though technical studies are unwinding from severe overextension, suggesting some form of a meaningful bottom could be in place. Back above 1.1274 will strengthen the recovery outlook.GBPUSD – fundamental overview
The Pound recovery has stumbled as the UK PM sticks with her tax cut plan. Meanwhile UK house prices stalled out in September, showing no growth for the first time in a year. Key standouts on Monday’s calendar come from German, Eurozone, UK, Canada, and US PMI reads, US construction spending, and some Fed speak.USDJPY – technical overview
Technical studies are looking quite stretched on the longer-term chart, warning of consolidation and correction in the days and weeks ahead. Look for additional upside from here to be well capped into the 145.00 area. Next key support comes in at 140.35.USDJPY – fundamental overview
The Yen sits just off multi-year low levels and back around pre-intervention levels from September, despite the BOJ's aggressive attempts to force a reversal of flow last month. Key standouts on Monday’s calendar come from German, Eurozone, UK, Canada, and US PMI reads, US construction spending, and some Fed speak.AUDUSD – technical overview
Overall pressure remains on the downside with the market confined to a well defined downtrend. A break back above 0.6682 would be required to take the pressure off the downside. Until then, scope exists for deeper setbacks towards 0.6000.AUDUSD – fundamental overview
The Australian Dollar remains weighed down on macro themes but has managed to find some relative strength on a rise in private sector credit growth. Key standouts on Monday’s calendar come from German, Eurozone, UK, Canada, and US PMI reads, US construction spending, and some Fed speak.USDCAD – technical overview
A recent surge back above 1.3000 signals an end to a period of bearish consolidation and suggests the market is in the process of carving out a more significant longer-term base. Next key resistance now comes in up into the 1.4000 area. Setbacks should be very well supported down into the 1.3000 area.USDCAD – fundamental overview
The Canadian Dollar has been slammed to multi-month lows on the downturn in global sentiment and broad based demand for the US Dollar. Key standouts on Monday’s calendar come from German, Eurozone, UK, Canada, and US PMI reads, US construction spending, and some Fed speak.NZDUSD – technical overview
Overall pressure remains on the downside with the focus on a retest of the critical low from 2020 at 0.5469. A break back above 0.5755 would be required to take the immediate pressure off the downside.NZDUSD – fundamental overview
The New Zealand Dollar is mostly tracking with risk sentiment, which continues to deteriorate, pointing to further weakness in the exchange rate. Key standouts on Monday’s calendar come from German, Eurozone, UK, Canada, and US PMI reads, US construction spending, and some Fed speak.US SPX 500 – technical overview
Longer-term technical studies are in the process of unwinding from extended readings off record highs. Look for rallies to be well capped in favor of lower tops and lower lows. Back above 3922 will be required at a minimum to take the immediate pressure off the downside. Next major support comes in around 3200.US SPX 500 – fundamental overview
We've finally reached a point in the cycle where the Fed recognizes unanchored inflation expectations pose a greater downside risk than over-tightening. This is significant, as it means less investor friendly monetary policy that risks potential recession in the months ahead. Overall, we expect inflation to continue to be a problem in 2022 that results in downside pressure into rallies.GOLD (SPOT) – technical overview
The 2019 breakout above the 2016 high at 1375 was a significant development, opening the door for fresh record highs. Setbacks should now be well supported above 1600 on a monthly close basis ahead of the next major upside extension.GOLD (SPOT) – fundamental overview
The yellow metal continues to be well supported on dips with solid demand from medium and longer-term accounts. These players are more concerned about inflation risk and a less upbeat global growth outlook. All of this should keep the commodity well supported, with many market participants also fleeing to the hard asset as the grand dichotomy of record high equities and record low yields comes to an unnerving climax.