


Next 24 hours: Have we reached peak inflation?
Today’s report: All about inflation expectations
Market movement is all about US inflation expectations these days. Last week, stocks surged and the US Dollar sold off aggressively on the release of a softer than expected CPI print. This week, we got another soft inflation read out of the US.
Wake-up call
- German ZEW
- Wage prices
- Japan GDP
- higher rates
- home prices
- Yield differentials
- Inflation headache
- Dealers report
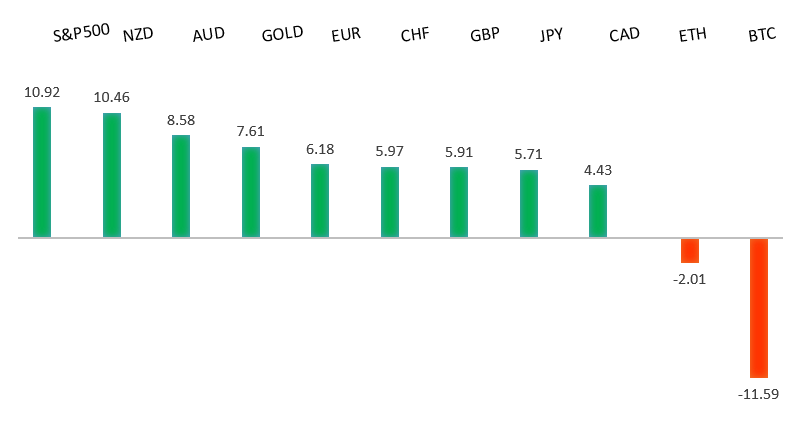
Peformance chart: 30 Day Performance vs. US dollar (%)
Suggested reading
- What Prompted Xi Jinping’s Swift Turn From Zero to Hero?, S. Ren, Bloomberg (November 16, 2022)
- Can Rapid Delivery Apps Get Back on Track?, S. O'Connor, Financial Times (November 14, 2022)
Chart talk: Technical & fundamental highlights
Choose pair:
EURUSD – technical overview
A break back above important resistance at 1.0200 suggests the market could be in the process of carving out a longer-term base after sinking to a multi-year low. Look for any setbacks to now be well supported ahead of 0.9900, with only a break back below 0.9730 to compromise the shifting outlook. Next key resistance comes in by previous support at 1.0636.EURUSD – fundamental overview
German ZEW reads came in a good deal better than expected, while US producer prices were a good deal softer. This was behind the latest push higher in the Euro. Key standouts on Wednesday’s calendar come from UK inflation reads, Canada inflation reads, US retail sales, US industrial production, US business inventories, US NAHB housing, and Fed speak.EURUSD - Technical charts in detail
GBPUSD – technical overview
Signs have emerged of the market wanting to put in a longer-term base after collapsing to a record low in September. The latest weekly close back above the September high at 1.1739 strengthens this prospect. Any setbacks should now be well supported ahead of 1.1100. Next key resistance comes in at 1.2294.GBPUSD – fundamental overview
The Pound was a standout outperformer on Tuesday, initially finding demand from the UK jobs data which showed wages rising at their fastest pace in more than a year. This inspired a repricing of BOE rate hike bets. At the same time, the Pound also got a boost from broad based US Dollar selling on the back of the softer US PPI read. Key standouts on Wednesday’s calendar come from UK inflation reads, Canada inflation reads, US retail sales, US industrial production, US business inventories, US NAHB housing, and Fed speak.USDJPY – technical overview
Longer-term technical studies are in the process of unwinding from severe overbought readings. Look for additional corrective price action back down towards the 130.00 area before the market considers the possibility of uptrend resumption. Rallies should now be well capped ahead of 147.00.USDJPY – fundamental overview
The Yen was initially softer on Tuesday after the bad Japan GDP miss, before finding support on the back of the broad based US Dollar selloff from softer US producer prices. Key standouts on Wednesday’s calendar come from UK inflation reads, Canada inflation reads, US retail sales, US industrial production, US business inventories, US NAHB housing, and Fed speak.AUDUSD – technical overview
There are signs of the potential formation of a longer-term base following the recent surge back above 0.6500. The latest weekly close back above previous support now turned resistance at 0.6682 strengthens the outlook for a bullish structural shift.AUDUSD – fundamental overview
The RBA Minutes revealed policymakers were prepared to return to larger rate hikes if needed. This along with a soft US producer prices print helped to fuel Aussie demand. Key standouts on Wednesday’s calendar come from UK inflation reads, Canada inflation reads, US retail sales, US industrial production, US business inventories, US NAHB housing, and Fed speak.USDCAD – technical overview
A recent surge back above 1.3000 signals an end to a period of bearish consolidation and suggests the market is in the process of carving out a more significant longer-term base. Next key resistance now comes in up into the 1.4000 area. Setbacks should be very well supported down into the 1.3000 area.USDCAD – fundamental overview
Though the Canadian Dollar was bid against the Buck on Tuesday, the currency has been underperforming against its peers on struggling Canada home prices. Key standouts on Wednesday’s calendar come from UK inflation reads, Canada inflation reads, US retail sales, US industrial production, US business inventories, US NAHB housing, and Fed speak.NZDUSD – technical overview
Overall pressure remains on the downside with risk for the current recovery rally to stall out and form a lower top for the next major downside extension. A break back above 0.6251 would be required to take the immediate pressure off the downside.NZDUSD – fundamental overview
The New Zealand Dollar continues to benefit from the combination of shifting expectations for higher rates from the RBNZ, and softer US inflation data suggesting the Fed may ease up on its rate hike timeline. Key standouts on Wednesday’s calendar come from UK inflation reads, Canada inflation reads, US retail sales, US industrial production, US business inventories, US NAHB housing, and Fed speak.US SPX 500 – technical overview
Longer-term technical studies are in the process of unwinding from extended readings off record highs. Look for rallies to be well capped in favor of lower tops and lower lows. A monthly close back above 4000 will be required at a minimum to take the immediate pressure off the downside. Next major support comes in around 3200.US SPX 500 – fundamental overview
We've finally reached a point in the cycle where the Fed recognizes unanchored inflation expectations pose a greater downside risk than over-tightening. This is significant, as it means less investor friendly monetary policy that risks potential recession in the months ahead. Overall, we expect inflation to continue to be a problem in Q4 2022 and Q1 2023 that results in downside pressure into rallies.GOLD (SPOT) – technical overview
The 2019 breakout above the 2016 high at 1375 was a significant development, opening the door for fresh record highs. Setbacks should now be well supported above 1600 on a monthly close basis ahead of the next major upside extension. Back above 1808 will strengthen the bullish outlook.GOLD (SPOT) – fundamental overview
The yellow metal continues to be well supported on dips with solid demand from medium and longer-term accounts. These players are more concerned about inflation risk and a less upbeat global growth outlook. All of this should keep the commodity well supported, with many market participants also fleeing to the hard asset as the grand dichotomy of record high equities and record low yields comes to an unnerving climax.