


Today’s report: Proceed with caution
As the week comes to a close, we’re looking at a market that is trying as hard as it can to push the narrative for less aggressive central bank policy. Investors have keyed in on everything they can to point to this case, betting the Fed will finally relent with respect to the rate hike outlook.
Wake-up call
- Eurozone unemployment
- House prices
- BOJ Tamura
- RBA Lowe
- Oil bounce
- Hawkish RBNZ
- Inflation headache
- Dealers report
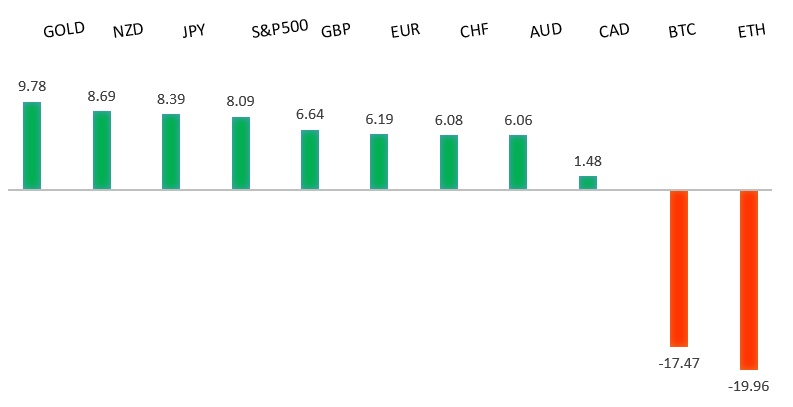
Peformance chart: 30 Day Performance vs. US dollar (%)
Suggested reading
- SBF Missed FTX’s Risks, M. Levine, Bloomberg (December 1, 2022)
- Has Big Oil Changed?, G. Bobillot, Financial Times (December 1, 2022)
Chart talk: Technical & fundamental highlights
Choose pair:
EURUSD – technical overview
A break back above important resistance at 1.0200 suggests the market could be in the process of carving out a longer-term base after sinking to a multi-year low. Look for any setbacks to now be well supported ahead of 0.9900, with only a break back below 0.9730 to compromise the shifting outlook. Next key resistance comes in by previous support at 1.0636.EURUSD – fundamental overview
Softer Eurozone inflation reads, a lower Eurozone unemployment rate, and broad based risk on flow from less hawkish Fed Chair comments have all been behind this latest run higher in the Euro. Key standouts on Friday’s calendar come from German trade, Eurozone producer prices, and the monthly employment reports out of Canada and the USA.EURUSD - Technical charts in detail
GBPUSD – technical overview
Signs have emerged of the market wanting to put in a longer-term base after collapsing to a record low in September. The latest weekly close back above the September high at 1.1739 strengthens this prospect. Any setbacks should now be well supported ahead of 1.1100. Next key resistance comes in at 1.2407.GBPUSD – fundamental overview
Pound outperformance has been impressive, with the currency getting a boost from an easing in UK house prices and upward revisions to PMI data. Key standouts on Friday’s calendar come from German trade, Eurozone producer prices, and the monthly employment reports out of Canada and the USA.USDJPY – technical overview
Longer-term technical studies are in the process of unwinding from severe overbought readings. Look for additional corrective price action back down towards the 130.00 area before the market considers the possibility of uptrend resumption. Rallies should now be well capped ahead of 140.00.USDJPY – fundamental overview
The Yen has been better bid in recent sessions, getting a boost from the combination of hotter Japan inflation data and broad based US Dollar weakness. On Thursday, we saw reason for additional Yen upside after BOJ Tamura said it was getting close to conducting a policy assessment. Key standouts on Friday’s calendar come from German trade, Eurozone producer prices, and the monthly employment reports out of Canada and the USA.AUDUSD – technical overview
There are signs of the potential formation of a longer-term base following the recent surge back above 0.6500. The latest weekly close back above previous support now turned resistance at 0.6682 strengthens the outlook for a bullish structural shift.AUDUSD – fundamental overview
The Australian Dollar has traded higher on the back of broad based US Dollar outflows and a resurgence in risk appetite, but has also lagged its peers on weak capital formation data and unimpressive retail sales. Meanwhile, RBA Lowe was on the wires saying the RBA's decision to lead the world in downshifting to quarter-point hikes reflected the rapid tightening it had already undertaken and the lags in monetary policy. Key standouts on Friday’s calendar come from German trade, Eurozone producer prices, and the monthly employment reports out of Canada and the USA.USDCAD – technical overview
A recent surge back above 1.3000 signals an end to a period of bearish consolidation and suggests the market is in the process of carving out a more significant longer-term base. Next key resistance now comes in up into the 1.4000 area. Setbacks should be very well supported down into the 1.3000 area.USDCAD – fundamental overview
The Canadian Dollar has been a standout underperformer in recent weeks, but did manage to put in an impressive recovery on Wednesday, getting help from an impressive bounce in the price of oil and risk on flow. Key standouts on Friday’s calendar come from German trade, Eurozone producer prices, and the monthly employment reports out of Canada and the USA.NZDUSD – technical overview
Overall pressure remains on the downside with risk for the current recovery rally to stall out and form a lower top for the next major downside extension. A break back above 0.6469 would be required to take the immediate pressure off the downside.NZDUSD – fundamental overview
The market believes the RBNZ will remain firm on its rate hike plan, which has been helping to drive Kiwi outperformance in recent sessions. Key standouts on Friday’s calendar come from German trade, Eurozone producer prices, and the monthly employment reports out of Canada and the USA.US SPX 500 – technical overview
Longer-term technical studies are in the process of unwinding from extended readings off record highs. Look for rallies to be well capped in favor of lower tops and lower lows. A monthly close back above 4300 will be required at a minimum to take the immediate pressure off the downside. Next major support comes in at 3492.US SPX 500 – fundamental overview
We've finally reached a point in the cycle where the Fed recognizes unanchored inflation expectations pose a greater downside risk than over-tightening. This is significant, as it means less investor friendly monetary policy that risks potential recession in the months ahead. Overall, we expect inflation to continue to be a problem in Q4 2022 and Q1 2023 that results in downside pressure into rallies.GOLD (SPOT) – technical overview
The 2019 breakout above the 2016 high at 1375 was a significant development, opening the door for fresh record highs. Setbacks should now be well supported above 1600 on a monthly close basis ahead of the next major upside extension. Back above 1808 will strengthen the bullish outlook.GOLD (SPOT) – fundamental overview
The yellow metal continues to be well supported on dips with solid demand from medium and longer-term accounts. These players are more concerned about inflation risk and a less upbeat global growth outlook. All of this should keep the commodity well supported, with many market participants also fleeing to the hard asset as the grand dichotomy of record high equities and record low yields comes to an unnerving climax.