


Next 24 hours: Price action that confounds
Today’s report: Questionable currency gains against the Buck
We’re actually surprised to see markets trading how they have been in the aftermath of Friday’s US jobs report. Risk sentiment has held up surprisingly well and the US Dollar has extended declines against many currencies, despite a strong US jobs report.
Wake-up call
- Ukraine negotiations
- services PMIs
- policy shift
- inflation data
- jobs report
- Hawkish RBNZ
- Inflation headache
- Dealers report
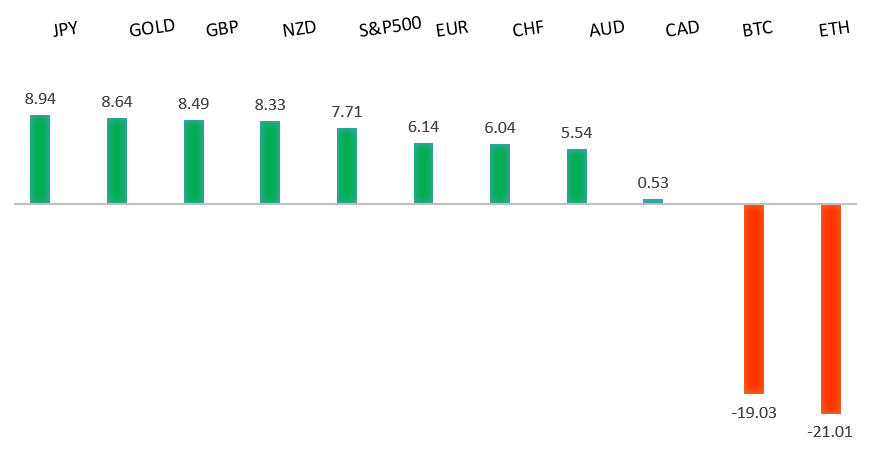
Peformance chart: 30 Day Performance vs. US dollar (%)
Suggested reading
- Last Exit from Blackstone?, C. Hughes, Bloomberg (December 2, 2022)
- Has Big Oil Changed?, G. Bobillot, Financial Times (December 1, 2022)
Chart talk: Technical & fundamental highlights
Choose pair:
EURUSD – technical overview
A break back above important resistance at 1.0200 suggests the market could be in the process of carving out a longer-term base after sinking to a multi-year low. Look for any setbacks to now be well supported ahead of 0.9900, with only a break back below 0.9730 to compromise the shifting outlook. Next key resistance comes in by previous support at 1.0635.EURUSD – fundamental overview
Eurozone producer prices eased to 30.8% y/y from 41.9%, which was seen taking pressure off of corporate margins. Meanwhile, forward movement on possible Ukraine negotiations was able to lift sentiment. Russia's Putin said he was ready for talks with US. Key standouts on Monday’s calendar come from an ECB Lagarde speech, services PMI reads out of the Eurozone, Germany, and UK, Eurozone retail sales, US ISM non-manufacturing and factory orders, and Canada building permits.EURUSD - Technical charts in detail
GBPUSD – technical overview
Signs have emerged of the market wanting to put in a longer-term base after collapsing to a record low in September. The latest weekly close back above the September high at 1.1739 strengthens this prospect. Any setbacks should now be well supported ahead of 1.1100. Next key resistance comes in at 1.2407.GBPUSD – fundamental overview
Pound outperformance has been impressive, with the currency getting a boost from an easing in UK house prices, upward revisions to PMI data and broad based US Dollar outflows. Key standouts on Monday’s calendar come from an ECB Lagarde speech, services PMI reads out of the Eurozone, Germany, and UK, Eurozone retail sales, US ISM non-manufacturing and factory orders, and Canada building permits.USDJPY – technical overview
Longer-term technical studies are in the process of unwinding from severe overbought readings. Look for additional corrective price action back down towards the 130.00 area before the market considers the possibility of uptrend resumption. Rallies should now be well capped ahead of 140.00.USDJPY – fundamental overview
The Yen has been better bid in recent sessions, getting a boost from the combination of hotter Japan inflation data and broad based US Dollar weakness. And last week, we saw reason for additional Yen upside after BOJ Tamura said it was getting close to conducting a policy assessment. Key standouts on Monday’s calendar come from an ECB Lagarde speech, services PMI reads out of the Eurozone, Germany, and UK, Eurozone retail sales, US ISM non-manufacturing and factory orders, and Canada building permits.AUDUSD – technical overview
There are signs of the potential formation of a longer-term base following the recent surge back above 0.6500. The latest weekly close back above previous support now turned resistance at 0.6682 strengthens the outlook for a bullish structural shift.AUDUSD – fundamental overview
The Australian Dollar has traded higher on the back of broad based US Dollar outflows, rallying metals and a resurgence in risk appetite, but has also lagged its peers on weak capital formation data and unimpressive retail sales. Earlier, Aussie inflation in November rose 5.9% from a year earlier, the fastest pace on record, heaping pressure on households and businesses. Key standouts on Monday’s calendar come from an ECB Lagarde speech, services PMI reads out of the Eurozone, Germany, and UK, Eurozone retail sales, US ISM non-manufacturing and factory orders, and Canada building permits.USDCAD – technical overview
A recent surge back above 1.3000 signals an end to a period of bearish consolidation and suggests the market is in the process of carving out a more significant longer-term base. Next key resistance now comes in up into the 1.4000 area. Setbacks should be very well supported down into the 1.3000 area.USDCAD – fundamental overview
The Canadian Dollar has been a standout underperformer in recent weeks. Economic data has been soft overall and oil prices remain weighed down. Friday's Canada jobs report was yet another example of discouraging economic data. Key standouts on Monday’s calendar come from an ECB Lagarde speech, services PMI reads out of the Eurozone, Germany, and UK, Eurozone retail sales, US ISM non-manufacturing and factory orders, and Canada building permits.NZDUSD – technical overview
Overall pressure remains on the downside with risk for the current recovery rally to stall out and form a lower top for the next major downside extension. A break back above 0.6469 would be required to take the immediate pressure off the downside.NZDUSD – fundamental overview
The market believes the RBNZ will remain firm on its rate hike plan, which has been helping to drive Kiwi outperformance in recent sessions. Key standouts on Monday’s calendar come from an ECB Lagarde speech, services PMI reads out of the Eurozone, Germany, and UK, Eurozone retail sales, US ISM non-manufacturing and factory orders, and Canada building permits.US SPX 500 – technical overview
Longer-term technical studies are in the process of unwinding from extended readings off record highs. Look for rallies to be well capped in favor of lower tops and lower lows. A monthly close back above 4300 will be required at a minimum to take the immediate pressure off the downside. Next major support comes in at 3492.US SPX 500 – fundamental overview
We've finally reached a point in the cycle where the Fed recognizes unanchored inflation expectations pose a greater downside risk than over-tightening. This is significant, as it means less investor friendly monetary policy that risks potential recession in the months ahead. Overall, we expect inflation to continue to be a problem in Q4 2022 and Q1 2023 that results in downside pressure into rallies.GOLD (SPOT) – technical overview
The 2019 breakout above the 2016 high at 1375 was a significant development, opening the door for fresh record highs. Setbacks should now be well supported above 1600 on a monthly close basis ahead of the next major upside extension. This latest break back above 1808 strengthens the bullish outlook.GOLD (SPOT) – fundamental overview
The yellow metal continues to be well supported on dips with solid demand from medium and longer-term accounts. These players are more concerned about inflation risk and a less upbeat global growth outlook. All of this should keep the commodity well supported, with many market participants also fleeing to the hard asset as the grand dichotomy of record high equities and record low yields comes to an unnerving climax.