


Next 24 hours: US market returns from holiday break
Today’s report: China data exceeds expectation
The market is already digesting its first big batch of data for the day, this after a round of China reads came out. On the whole, despite the data weakening from previous prints, the results were a net positive relative to expectation.
Wake-up call
- ECB Rehn
- UK data
- BOJ Governor
- Bill Evans
- manufacturing sales
- against peers
- Inflation headache
- Dealers report
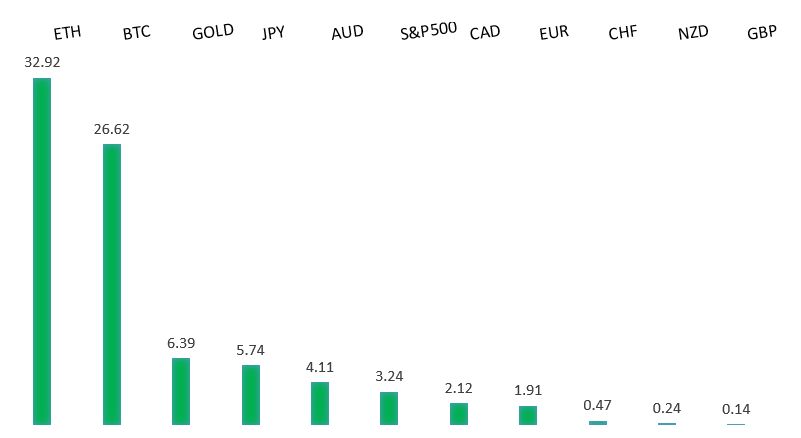
Peformance chart: 30 Day Performance vs. US dollar (%)
Suggested reading
- Traders Can’t Predict the Market. Maybe Their Faces Can., P. Olson, Bloomberg (January 17, 2023)
- Fusion Power: How Close Are We?, S. Mundy, Financial Times (January 16, 2023)
Chart talk: Technical & fundamental highlights
Choose pair:
EURUSD – technical overview
The Euro recovery has finally run back above meaningful previous support turned resistance at 1.0635. The December close above this level further encourages the recovery outlook and makes a stronger case for the formation of a longer-term bottom. Any setbacks should now be well supported ahead of 1.0300. Next major resistance at 1.1000.EURUSD – fundamental overview
More hawkish speak out from ECB officials has continued to keep the Euro well supported on dips. ECB Rehn was the latest, after saying he saw significant rate hikes at the next few meetings. Key standouts on Tuesday’s calendar come from German inflation, UK employment, Eurozone ZEW reads, Canada housing starts and inflation, NY empire state manufacturing, and a Fed Williams speech.EURUSD - Technical charts in detail
GBPUSD – technical overview
Signs have emerged of the market wanting to put in a longer-term base after collapsing to a record low in September. The latest weekly close back above the September high at 1.1739 strengthens this prospect. Any setbacks should now be well supported ahead of 1.1500. Next key resistance comes in at 1.2668.GBPUSD – fundamental overview
The Pound has been holding up well of late on the back of last week's solid UK GDP and Monday's impressive housing data. Key standouts on Tuesday’s calendar come from German inflation, UK employment, Eurozone ZEW reads, Canada housing starts and inflation, NY empire state manufacturing, and a Fed Williams speech.USDJPY – technical overview
The major pair has been in the throes of a long overdue correction that was waiting to play out after a parabolic run to the topside to multi-year highs. At this stage, the correction could be getting close to having played out fully, with the market finally approaching critical previous resistance turned support in the 125.00 area.USDJPY – fundamental overview
Japan's government is considering submitting its nominations for Bank of Japan governor and deputy governors around February 10. Most economists see Deputy Governor Masayoshi Amamiya as the front-runner to replace Kuroda. Still there is chatter of someone else taking the position, which could signal a shift in policy. Key standouts on Tuesday’s calendar come from German inflation, UK employment, Eurozone ZEW reads, Canada housing starts and inflation, NY empire state manufacturing, and a Fed Williams speech.AUDUSD – technical overview
There are signs of the potential formation of a longer-term base following the recent surge back above 0.6500. The recent weekly close back above previous support now turned resistance at 0.6682 strengthens the outlook for a bullish structural shift. Next key resistance comes in at 0.7137.AUDUSD – fundamental overview
Australia consumer confidence jumped 5%, the largest monthly gain since April 2021. Meanwhile, consumer sentiment climbed to 84.3. Still, Chief Economist Bill Evans urged caution in interpreting the rise in sentiment as an upward trend, pointing out there wasn't 'an explicit decision' to pause tightening. Key standouts on Tuesday’s calendar come from German inflation, UK employment, Eurozone ZEW reads, Canada housing starts and inflation, NY empire state manufacturing, and a Fed Williams speech.USDCAD – technical overview
A recent surge back above 1.3000 signals an end to a period of bearish consolidation and suggests the market is in the process of carving out a more significant longer-term base. Next key resistance now comes in up into the 1.4000 area. Setbacks should be very well supported down into the 1.3000 area.USDCAD – fundamental overview
Canada manufacturing sales came in well below forecast on Monday, which factored into some of the Canadian Dollar selling. Key standouts on Tuesday’s calendar come from German inflation, UK employment, Eurozone ZEW reads, Canada housing starts and inflation, NY empire state manufacturing, and a Fed Williams speech.NZDUSD – technical overview
Overall pressure remains on the downside with risk for the current recovery rally to stall out and form a lower top for the next major downside extension. A break back above 0.6577 would be required to take the immediate pressure off the downside.NZDUSD – fundamental overview
Despite gains against the US Dollar in recent sessions, the Kiwi rate has underperformed against most of its peers on the back of a sharp decline in housing data, a soft commodities price index, and fresh doubts about just how much the RBNZ will need to shift to a less hawkish policy stance. Key standouts on Tuesday’s calendar come from German inflation, UK employment, Eurozone ZEW reads, Canada housing starts and inflation, NY empire state manufacturing, and a Fed Williams speech.US SPX 500 – technical overview
Longer-term technical studies are in the process of unwinding from extended readings off record highs. Look for rallies to be well capped in favor of lower tops and lower lows. A monthly close back above 4300 will be required at a minimum to take the immediate pressure off the downside. Next major support comes in at 3492.US SPX 500 – fundamental overview
We've finally reached a point in the cycle where the Fed recognizes unanchored inflation expectations pose a greater downside risk than over-tightening. This is significant, as it means less investor friendly monetary policy that risks potential recession in the months ahead. Overall, we expect inflation to continue to be a problem in H1 2023 that results in downside pressure into rallies.GOLD (SPOT) – technical overview
The 2019 breakout above the 2016 high at 1375 was a significant development, opening the door for fresh record highs. Setbacks should now be well supported above 1600 on a monthly close basis ahead of the next major upside extension. The recent break back above 1808 strengthens the bullish outlook. Next major resistance comes in at 2000.GOLD (SPOT) – fundamental overview
The yellow metal continues to be well supported on dips with solid demand from medium and longer-term accounts. These players are more concerned about inflation risk and a less upbeat global growth outlook. All of this should keep the commodity well supported, with many market participants also fleeing to the hard asset as the grand dichotomy of record high equities and record low yields comes to an unnerving climax.