


Special report: US CPI Preview
Today’s report: Reason to worry
We’re concerned about recent price action in risk markets, when considering the fact that Fed rate pricing has come down, with some major institutions now expecting the Fed to completely hold off on hiking rates next week.
Wake-up call
- pricing tumbles
- US woes
- Fed repricing
- risk sentiment
- local data
- food prices
- Inflation headache
- Dealers report
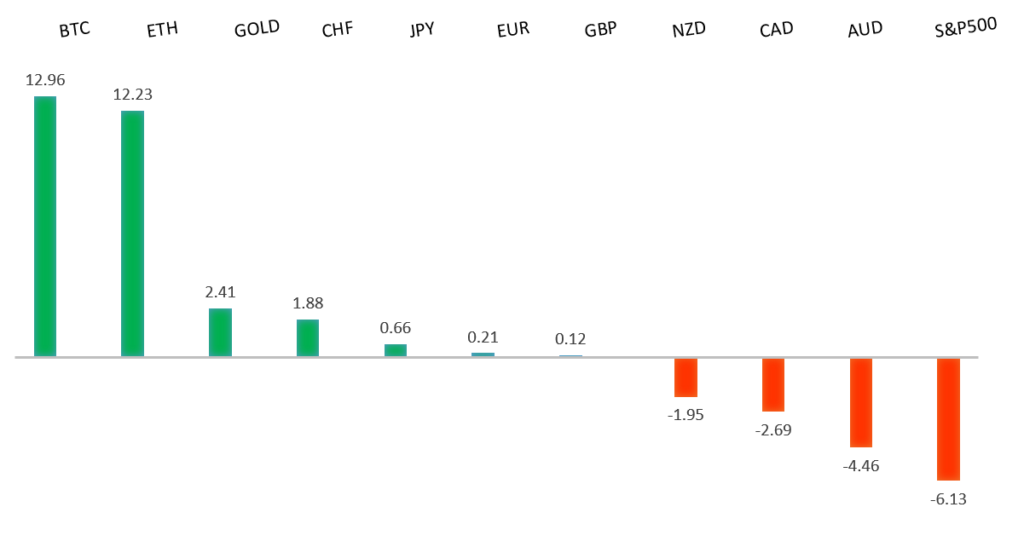
Peformance chart: 30 Day Performance vs. US dollar (%)
Suggested reading
- Fed’s Inflation Fight Is Not Over, J. Authers, Bloomberg (March 14, 2023)
- A One-Stop Investment Shop for the Global Elite, S. Indap, Morningstar (March 9, 2023)
Chart talk: Technical & fundamental highlights
Choose pair:
EURUSD – technical overview
The Euro is in the throes of a correction following a run to the topside through 1.1000 earlier this year. Any additional setbacks should be well supported ahead of 1.0300 in favor of the formation of the next major higher low and a bullish continuation. Ultimately, only a monthly close back below parity would give reason for concern.EURUSD – fundamental overview
The Euro was a laggard on Monday, despite gains against the US Dollar, with the currency being held back on ECB peak rate pricing tumbling. Peak ECB rates fell to 3.75% as European banks came under pressure. Key standouts on today’s calendar come from UK employment, Canada manufacturing sales, and US CPI.EURUSD - Technical charts in detail
GBPUSD – technical overview
Signs have emerged of the market wanting to put in a longer-term base after collapsing to a record low in September 2022. The recent weekly close back above the September high at 1.1739 strengthens this prospect. Any setbacks should now be well supported ahead of 1.1500. Next key resistance comes in at 1.2668.GBPUSD – fundamental overview
The Pound continues to be a prime beneficiary of broad based US Dollar outflows, with the currency then accelerating further on the US banking woes and dovish repricing of Fed expectations. Key standouts on today’s calendar come from UK employment, Canada manufacturing sales, and US CPI.USDJPY – technical overview
The major pair has seen a nice recovery following the massive correction out from multi-year highs. Setbacks have finally been well supported ahead of 125.00 in the 127s thus far. At this stage, it looks like the market could be wanting to resume the bigger picture uptrend and head back towards a retest of that multi-year high from October 2022 up at 151.95. Look for any weakness to continue to be well supported in favor of higher lows along the way.USDJPY – fundamental overview
A good chunk of this latest flow back into the Yen comes from a repricing of Fed expectations in light of the US bank woes. Key standouts on today’s calendar come from UK employment, Canada manufacturing sales, and US CPI.AUDUSD – technical overview
There are signs of the potential formation of a longer-term base following the late 2022 surge back above 0.6500. The recent weekly close back above previous support now turned resistance at 0.6682 strengthens the outlook for a bullish structural shift. Next key resistance comes in at 0.7284. Setbacks should be well supported ahead of 0.6500.AUDUSD – fundamental overview
The Australian Dollar is enjoying a nice recovery this week, getting a boost from all of the risk on flow as the market repriced Fed expectations. Key standouts on today’s calendar come from UK employment, Canada manufacturing sales, and US CPI.USDCAD – technical overview
A recent surge back above 1.3000 signals an end to a period of bearish consolidation and suggests the market is in the process of carving out a more significant longer-term base. Next key resistance now comes in up into the 1.4000 area. Setbacks should be very well supported down into the 1.3000 area.USDCAD – fundamental overview
Canada employment data came in solid last Friday, and the market has repriced Fed rate hike expectations in light of the US bank woes. All of this has helped to fuel renewed demand into the Loonie. Key standouts on today’s calendar come from UK employment, Canada manufacturing sales, and US CPI.NZDUSD – technical overview
Overall pressure remains on the downside with the market once again stalling out on a run up into the 0.6500 area. Ultimately, a break back above 0.6577 would be required to take the immediate pressure off the downside.NZDUSD – fundamental overview
The New Zealand Dollar was already rallying on stronger NZ PMI reads, before getting an additional boost from local food prices posting their biggest annual rise since 1989, and risk on flow on the repricing of Fed rate expectations. Key standouts on today’s calendar come from UK employment, Canada manufacturing sales, and US CPI.US SPX 500 – technical overview
Longer-term technical studies are in the process of unwinding from extended readings off record highs. Look for rallies to be well capped in favor of lower tops and lower lows. A monthly close back above 4300 will be required at a minimum to take the immediate pressure off the downside. Next major support comes in at 3763.US SPX 500 – fundamental overview
We've finally reached a point in the cycle where the Fed recognizes unanchored inflation expectations pose a greater downside risk than over-tightening. This is significant, as it means less investor friendly monetary policy that risks potential recession in the months ahead. Overall, we expect inflation to continue to be a problem in H1 2023 that results in downside pressure into rallies.GOLD (SPOT) – technical overview
The 2019 breakout above the 2016 high at 1375 was a significant development, opening the door for fresh record highs. Setbacks should now be well supported above 1600 on a monthly close basis ahead of the next major upside extension. The recent break back above 1808 strengthens the bullish outlook. Next major resistance comes in at 2000.GOLD (SPOT) – fundamental overview
The yellow metal continues to be well supported on dips with solid demand from medium and longer-term accounts. These players are more concerned about inflation risk and a less upbeat global growth outlook. All of this should keep the commodity well supported, with many market participants also fleeing to the hard asset as the grand dichotomy of record high equities and record low yields comes to an unnerving climax.