


Today’s report: How confident is the market right now?
As we come into the weekly close, the big takeaway has been a clear repricing of Fed expectations. While the central bank has continued to highlight risks to inflation, the consensus in the market is that the Fed will be forced to scale it back with respect to its hawkishness.
Wake-up call
- cools off
- BOE hike
- traditional flow
- PMI reads
- Rallying commodities
- RBNZ economist
- Inflation headache
- Dealers report
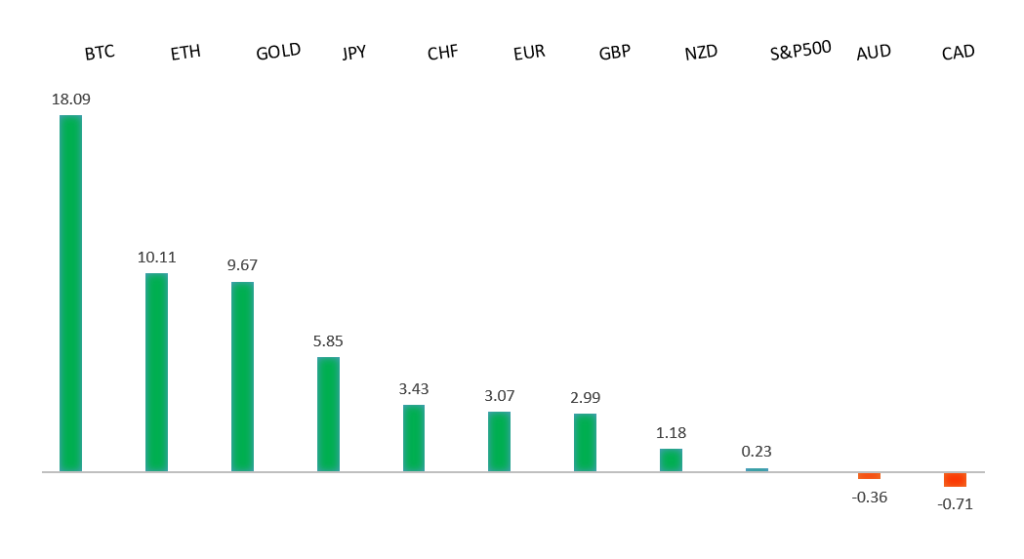
Peformance chart: 30 Day Performance vs. US dollar (%)
Suggested reading
- No, It's Not Like 15 Years Ago. What Matters Is 25, J. Authers, Bloomberg (March 24, 2023)
- Boeing's pioneering flight plan for green fuel jets, M. McCormick, FT (March 22, 2023)
Chart talk: Technical & fundamental highlights
Choose pair:
EURUSD – technical overview
The Euro remains well supported on dips following a run to the topside through 1.1000 earlier this year. Any additional setbacks should be well supported ahead of 1.0500 in favor of the formation of the next major higher low and a bullish continuation. Ultimately, only a monthly close back below 1.0500 would give reason for concern.EURUSD – fundamental overview
The Euro has come under mild pressure after advancing for the sixth day on Thursday. The stock market selloff was behind a lot of the pullback. Eurozone consumer confidence reads didn't factor much and were little changed from previous. Key standouts on Friday’s calendar come from UK retail sales, German and Eurozone PMI reads, UK PMI reads, Canada retail sales, and US durable goods orders.EURUSD - Technical charts in detail
GBPUSD – technical overview
Signs have emerged of the market wanting to put in a longer-term base after collapsing to a record low in September 2022. The recent weekly close back above the September high at 1.1739 strengthens this prospect. Any setbacks should now be well supported ahead of 1.1500. Next key resistance comes in at 1.2668.GBPUSD – fundamental overview
The Pound extended its recent run after the BOE went ahead and hiked rates 25 basis points while signaling the likelihood for further rate increases ahead. At the same time, the split 7-2 vote did open some selling into the rally. Key standouts on Friday’s calendar come from UK retail sales, German and Eurozone PMI reads, UK PMI reads, Canada retail sales, and US durable goods orders.USDJPY – technical overview
The major pair has seen a nice recovery following the massive correction out from multi-year highs. Setbacks have finally been well supported ahead of 125.00 in the 127s thus far. At this stage, it looks like the market could be wanting to resume the bigger picture uptrend and head back towards a retest of that multi-year high from October 2022 up at 151.95. Look for any weakness to continue to be well supported in favor of higher lows along the way.USDJPY – fundamental overview
The Yen has continue to hold up well on positive Japan data and safe haven bid appeal. Key standouts on Friday’s calendar come from UK retail sales, German and Eurozone PMI reads, UK PMI reads, Canada retail sales, and US durable goods orders.AUDUSD – technical overview
There are signs of the potential formation of a longer-term base following the late 2022 surge back above 0.6500. The recent weekly close back above previous support now turned resistance at 0.6682 strengthens the outlook for a bullish structural shift. Next key resistance comes in at 0.7284. Setbacks should be well supported ahead of 0.6500.AUDUSD – fundamental overview
Earlier today, Aussie PMI reads came in below forecast. At the same time, well supported commodities prices and broad US Dollar selling have managed to offset. Key standouts on Friday’s calendar come from UK retail sales, German and Eurozone PMI reads, UK PMI reads, Canada retail sales, and US durable goods orders.USDCAD – technical overview
A recent surge back above 1.3000 signals an end to a period of bearish consolidation and suggests the market is in the process of carving out a more significant longer-term base. Next key resistance now comes in up into the 1.4000 area. Setbacks should be very well supported down into the 1.3000 area.USDCAD – fundamental overview
Earlier this week, The Bank of Canada summary of deliberations showed it agreed to 'emphasize the conditionality' of its pause although it saw 'clear signals' hikes were impacting demand. The central bank acknowledged government spending grew more than anticipated in Q4 at 3.9%. There was no mention of a hike. All of this has weighed on the Loonie, though broad US Dollar selling on the Fed repricing and better bid commodities have helped to offset. Key standouts on Friday’s calendar come from UK retail sales, German and Eurozone PMI reads, UK PMI reads, Canada retail sales, and US durable goods orders.NZDUSD – technical overview
Overall pressure remains on the downside with the market once again stalling out on a run up into the 0.6500 area. Ultimately, a break back above 0.6577 would be required to take the immediate pressure off the downside.NZDUSD – fundamental overview
The RBNZ economist was out the other day with some balance speak saying rate hikes were having the desired effect, but that the central bank was ready to do more if the cyclone rebuild added to inflation. Key standouts on Friday’s calendar come from UK retail sales, German and Eurozone PMI reads, UK PMI reads, Canada retail sales, and US durable goods orders.US SPX 500 – technical overview
Longer-term technical studies are in the process of unwinding from extended readings off record highs. Look for rallies to be well capped in favor of lower tops and lower lows. A monthly close back above 4300 will be required at a minimum to take the immediate pressure off the downside. Next major support comes in at 3763.US SPX 500 – fundamental overview
We've finally reached a point in the cycle where the Fed recognizes unanchored inflation expectations pose a greater downside risk than over-tightening. This is significant, as it means less investor friendly monetary policy that risks potential recession in the months ahead. Overall, we expect inflation to continue to be a problem in H1 2023 that results in downside pressure into rallies.GOLD (SPOT) – technical overview
The 2019 breakout above the 2016 high at 1375 was a significant development, opening the door for fresh record highs. Setbacks should now be well supported above 1600 on a monthly close basis ahead of the next major upside extension. The recent break back above 1808 strengthens the bullish outlook. Next major resistance comes in at the record high from 2020 at 2076.GOLD (SPOT) – fundamental overview
The yellow metal continues to be well supported on dips with solid demand from medium and longer-term accounts. These players are more concerned about inflation risk and a less upbeat global growth outlook. All of this should keep the commodity well supported, with many market participants also fleeing to the hard asset as the grand dichotomy of record high equities and record low yields comes to an unnerving climax.