


Today’s report: Have you seen the Turkish Lira?
The US equity market just isn’t worried about rising inflation. This would normally be a red flag for less investor friendly central bank policy. But we aren’t living in normal times and the way things have been, point to the market once again pressuring the Fed into keeping with easy policy.
Wake-up call
- Dealers report
- COVID variant
- sentiment recovers
- iron ore
- Oil bounce
- hike odds
- Stocks vulnerable
- Dealers report
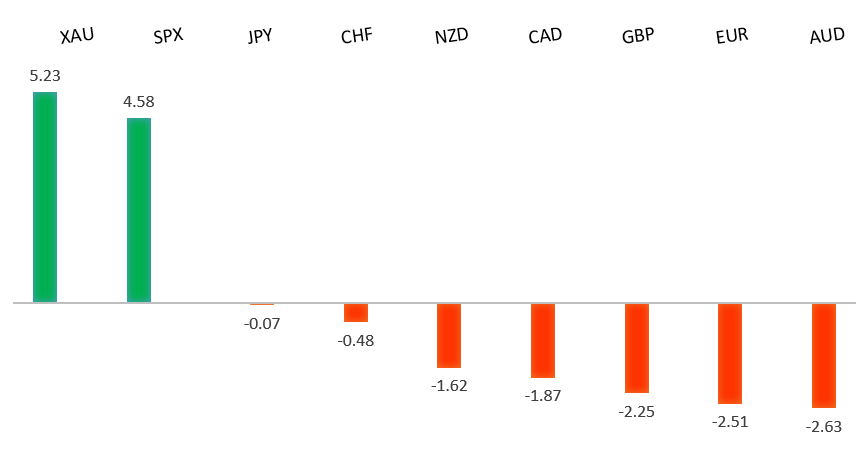
Peformance chart: 30 Day Performance vs. US dollar (%)
Suggested reading
- Where Did It All Go Wrong for Emerging Markets?, J. Authers, Bloomberg (November 20, 2021)
- Cryptocurrencies: How Regulators Lost Control, D. Garrahan, Financial Times (November 16, 2021)
Chart talk: Technical & fundamental highlights
Choose pair:
EURUSD – technical overview
Setbacks have extended to retest the critical 61.8% fib retrace off the 2020 low to 2021 high move. Technical studies are now tracking in extended territory on the weekly chart, warning of the need for a corrective bounce ahead. Look for the market to hold up on a weekly close basis above the 61.8% fib retrace around 1.1275.EURUSD – fundamental overview
More dovish speak from ECB officials and more soft data out of the Zone. And yet, the Euro managed to recover on the back of some oversold technical readings. Sellers continue to emerge into rallies. Key standouts on today’s calendar come in the form of UK retail sales, speeches from ECB Lagarde, Bundesbank Weidmann, Fed’s Waller and Clarida, and Canada retail sales.EURUSD - Technical charts in detail
GBPUSD – technical overview
The market is in a correction phase in the aftermath of the run to fresh multi-month highs earlier this year. At this stage, additional setbacks should be limited to the 1.3200 area ahead of the next major upside extension towards a retest and break of critical resistance in the form of the 2018 high.GBPUSD – fundamental overview
The fact that BOE rate hikes have been mostly priced in has now slowed the pace of GBP gains. Meanwhile, we're also looking at a COVID variant in the UK that is on the rise. Key standouts on today’s calendar come in the form of UK retail sales, speeches from ECB Lagarde, Bundesbank Weidmann, Fed’s Waller and Clarida, and Canada retail sales.USDJPY – technical overview
The longer-term trend is bearish despite the recent run higher. Look for additional upside to be limited, with scope for a topside failure and bearish resumption back down towards the 100.00 area. It would take a clear break back above 114.55 to negate the outlook.USDJPY – fundamental overview
Risk sentiment has managed to tick back up once again and the resulting price action has seen the Yen back under pressure into the end of the week. Japan headline CPI came in softer than expected but hasn't really factored into price action. Key standouts on today’s calendar come in the form of UK retail sales, speeches from ECB Lagarde, Bundesbank Weidmann, Fed’s Waller and Clarida, and Canada retail sales.AUDUSD – technical overview
The Australian Dollar has been in the process of a healthy consolidation following the impressive run towards a retest of the 2018 high earlier this year. At this stage, there are signs of the market wanting to turn back up and any setbacks should be well supported down into the 0.7200 area. Look for a weekly close above 0.7500 to strengthen the outlook and force a shift in the structure.AUDUSD – fundamental overview
The Australian Dollar has been under pressure overall this week, mostly on the back of discouraging local data and declining iron ore prices. However, risk sentiment has since picked back up a bit into the end of the week, which has supported Aussie on the dip. Key standouts on today’s calendar come in the form of UK retail sales, speeches from ECB Lagarde, Bundesbank Weidmann, Fed’s Waller and Clarida, and Canada retail sales.USDCAD – technical overview
Finally signs of a major bottom in the works after a severe decline from the 2020 high. A recent weekly close back above 1.2500 encourages the constructive outlook and opens the door for a push back towards next critical resistance in the 1.3000 area. Any setbacks should be well supported into the 1.2200s.USDCAD – fundamental overview
A recovery in the price of oil and overall market sentiment was behind the latest recovery in the Canadian Dollar. Key standouts on today’s calendar come in the form of UK retail sales, speeches from ECB Lagarde, Bundesbank Weidmann, Fed’s Waller and Clarida, and Canada retail sales.NZDUSD – technical overview
The market has entered a period of consolidation after running up to a yearly and multi-month high. Back above the April high at 0.7317 would be required to force a shift in the structure.NZDUSD – fundamental overview
The New Zealand Dollar has held up relatively well this week. We see this reconciled by the fact that New Zealand producer prices have shot up to their highest levels in a decade, which has increased odds of more RBNZ hikes ahead. The rebound in US equities has also helped. Key standouts on today’s calendar come in the form of UK retail sales, speeches from ECB Lagarde, Bundesbank Weidmann, Fed’s Waller and Clarida, and Canada retail sales.US SPX 500 – technical overview
Longer-term technical studies are looking quite exhausted and the market is showing signs of wanting to roll over after racing to another record high. At the same time, the latest breakout above 4600 introduces the possibility for the next major upside extension through 4800. At this stage, it will take a break back below 4500 to take the immediate pressure off the topside.US SPX 500 – fundamental overview
We're trading just off fresh record highs, and yet, with so little room for additional central bank accommodation, given an already depressed interest rate environment, the prospect for sustainable runs to the topside on easy money policy incentives and government stimulus, should no longer be as enticing to investors. Meanwhile, ongoing worry associated with coronavirus fallout and risk of rising inflation should weigh more heavily on investor sentiment in Q4 2021.GOLD (SPOT) – technical overview
The 2019 breakout above the 2016 high at 1375 was a significant development, opening the door for fresh record highs and an acceleration beyond the next major psychological barrier at 2000. Setbacks should now be well supported above 1600.GOLD (SPOT) – fundamental overview
The yellow metal continues to be well supported on dips with solid demand from medium and longer-term accounts. These players are more concerned about exhausted monetary policy, extended global equities, and coronavirus fallout. All of this should keep the commodity well supported, with many market participants also fleeing to the hard asset as the grand dichotomy of record high equities and record low yields comes to an unnerving climax.