


LMAX Exchange
When our first generation exchange was built, we were happy with low-millisecond-level mean latencies. After a couple of years of operation, we upgraded to newer hardware, made some significant software changes and ended up with mean end-to-end latencies of around 250 microseconds. With our latest set of changes, we are aiming for sub-100 microsecond mean latency and significantly reduced jitter.
These changes should stand us in good stead for another year or two, before we repeat the cycle to further improve performance. In order to achieve this goal, we have modified and tuned our hardware, system architecture, operating system and application software.
In my next few posts, I will be describing our experiences of doing this, and lessons we’ve learned along the way.
Recap – LMAX Exchange Architecture

- Inputs to our exchange arrive either from market makers who are generally responsible for making prices in the market, or customers who generally take the prices. All market maker traffic is based on the FIX protocol, customer traffic can be either FIX protocol, or XML/JSON over HTTP. The services responsible for access control and protocol translation are referred to as ‘Gateways’.
- Inbound and outbound traffic is tapped at the edge of our network. This allows us to have an authoritative record of data transfer with our customers, and also provides the ideal place to measure end-to-end latency.
- Market maker orders are converted to our internal message protocol, then routed over UDP straight to the matching engine.
- Customer orders are translated to internal messages, then routed to the order management and pre-trade risk engine (4a). Assuming that the customer has sufficient funds, their order will be forwarded to the matching engine (4b).
- The matching engine and order management engine are what we refer to as ‘Core Services’.
- These services journal inbound messages to disk (6a), and have an HA pair that receive and acknowledge messages (6b). Using these mechanisms, we protect ourselves from single-node service failure. Once messages have been journalled and replicated, they are passed on to the business-logic.
- Responses are published over UDP to the gateways for transmission back the the market maker or customer.
This describes the data flow in what we refer to as our latency-sensitive path. In the diagram above, each wheel icon represents a Disruptor instance, which is used extensively in our system.
Given this architecture, we necessarily tend to focus our attention on the core services, since these do the most work and actually model the business domain. The gateways are very lightweight, and are mainly just doing the translation work, they also have the nice property of being horizontally scalable if we need to lower the load of work being performed.
Two of the main costs that we need to address is the time taken to journal messages to disk, and to synchronously replicate messages out to a secondary. For this reason, it made sense to start looking at disk journalling performance.
Journalling Performance
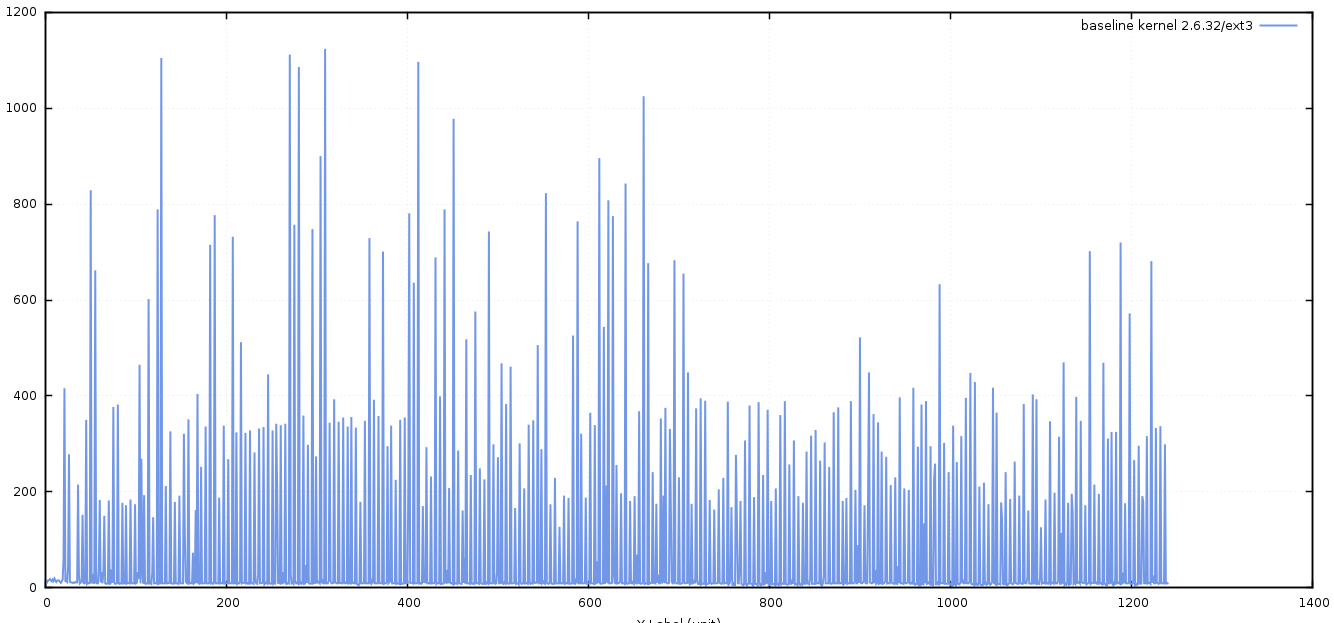
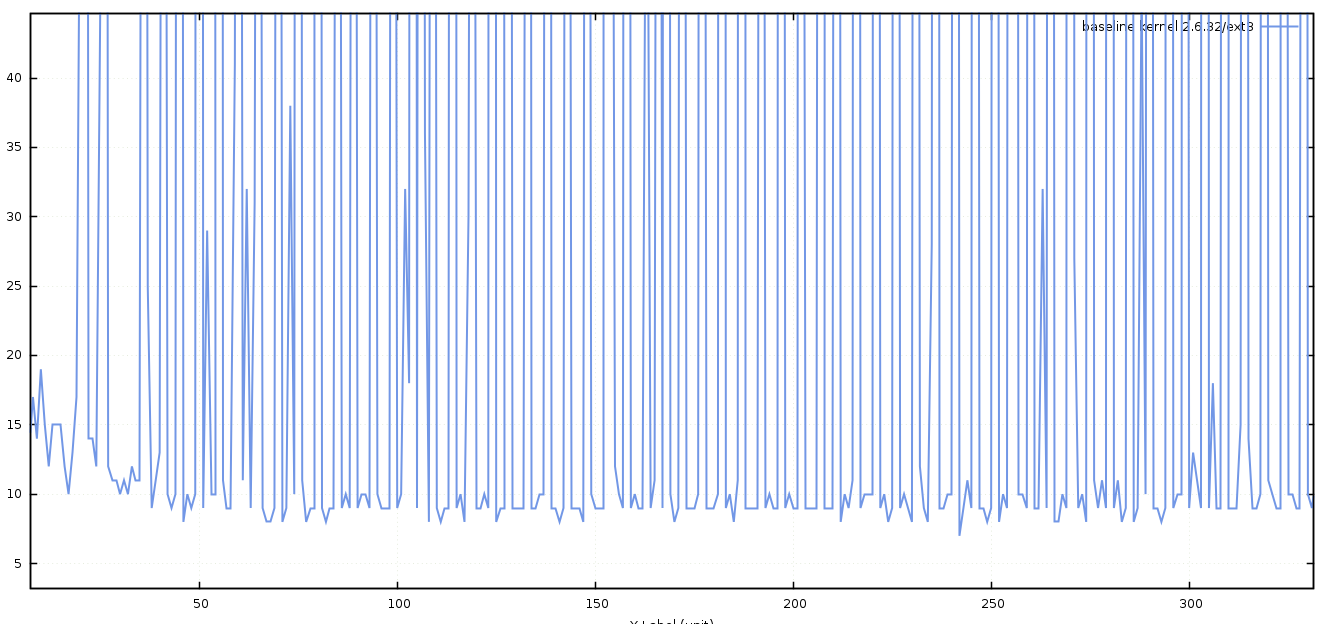
For the last few years, we’ve been running our systems on CentOS 6.4, kernel 2.6.32 and journalling messages to an ext3 file-system. The file-system is backed by a battery-backed RAID array, and we perform asynchronous writes – meaning that the data is only guaranteed to be in the operating system’s page cache after the write() call has returned. At the time, our testing showed this configuration to be the most performant, given the trade-offs of maturity of other file-systems and safety guarantees.
Testing also showed that from a software point-of-view, using the JDK’s RandomAccessFile gave the best performance for writes that always append to the end of a file. Using this technique, as messages arrive at a core service, they are appended to the current journal. When a journal reaches a certain size, the journaller rolls to the next file and continues appending data.
In order to determine what benefit we would get from changing the operating system/file-system/storage hardware, we needed to be able to accurately measure the time taken to journal incoming messages to disk.
First off of course, it’s necessary to be able to replicate production-like inbound traffic in a performance-test environment; see previous posts on how you might go about getting to this point.
Measuring the baseline
Once we were happy that we could adequately stress the system-under-test, we found that the best way to measure journalling latency was just to wrap the write call with a timer.
Our journaller was instrumented with a couple of calls to System.nanoTime():
The ValueRecorder component referenced here simply maintains a maximum-seen value and publishes this value to a monitoring endpoint every second or so. Using this small change, we were able to see exactly how long it was taking to perform an asynchronous write to underlying storage.
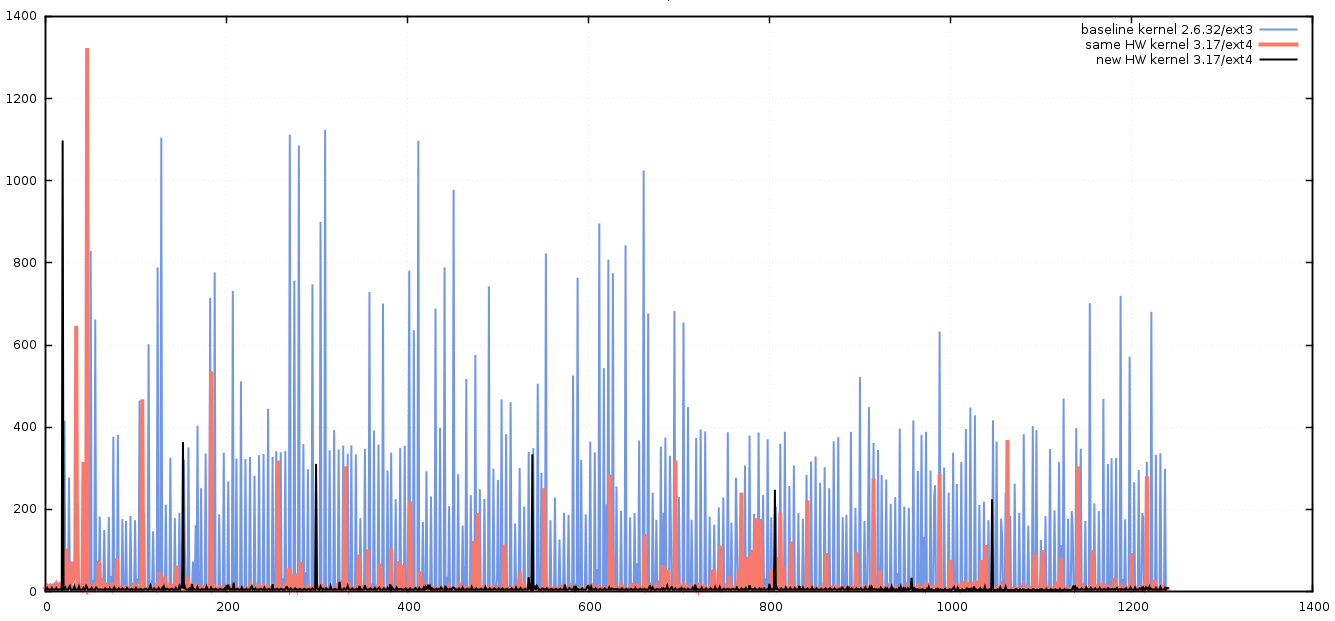
Armed with this ability to extract accurate metrics from our journaller, we ran a baseline test to see how the system was currently performing.
Measuring improvements
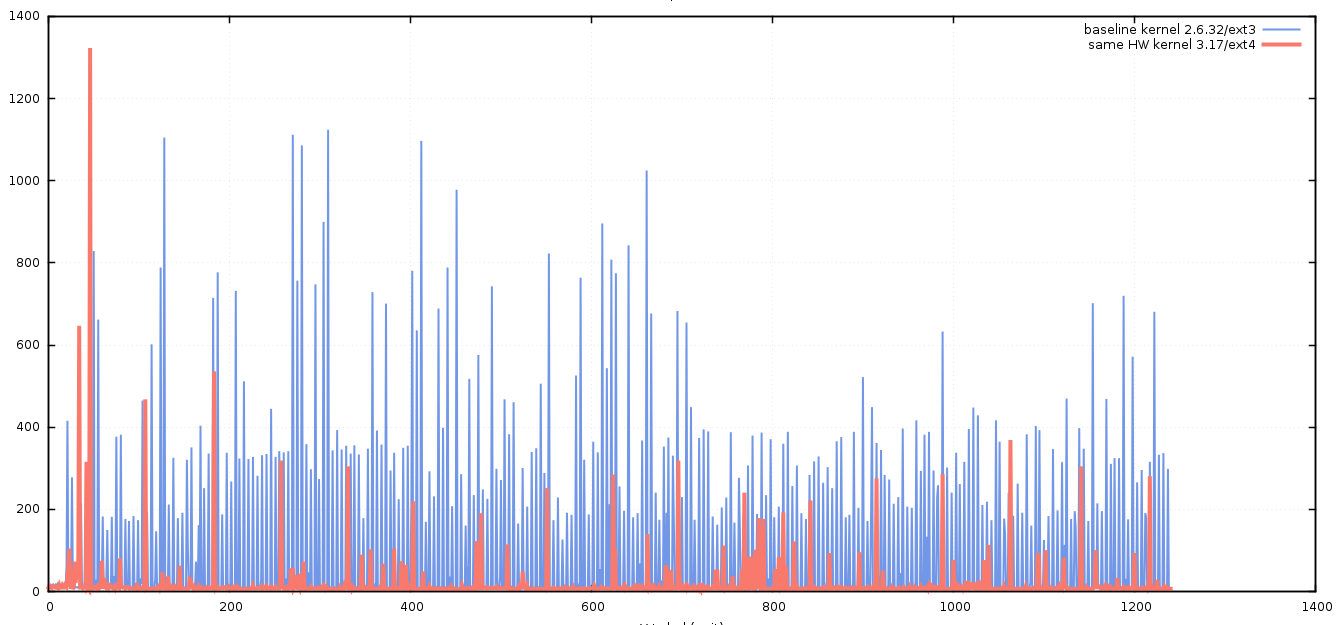
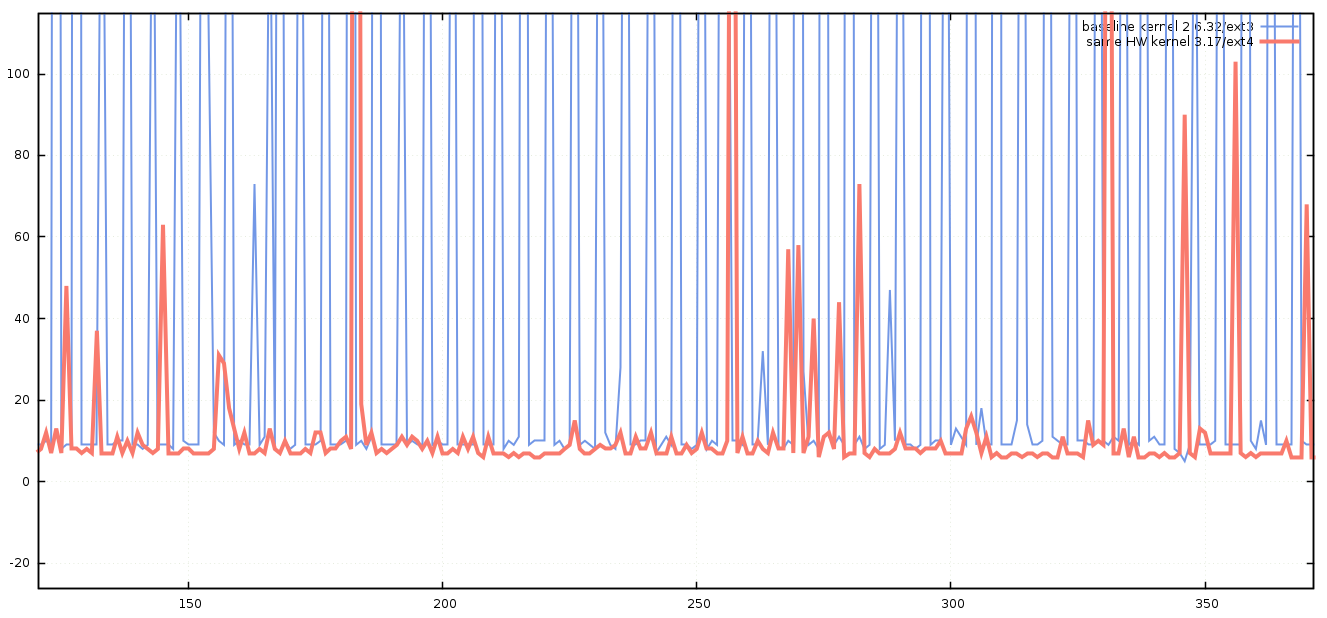
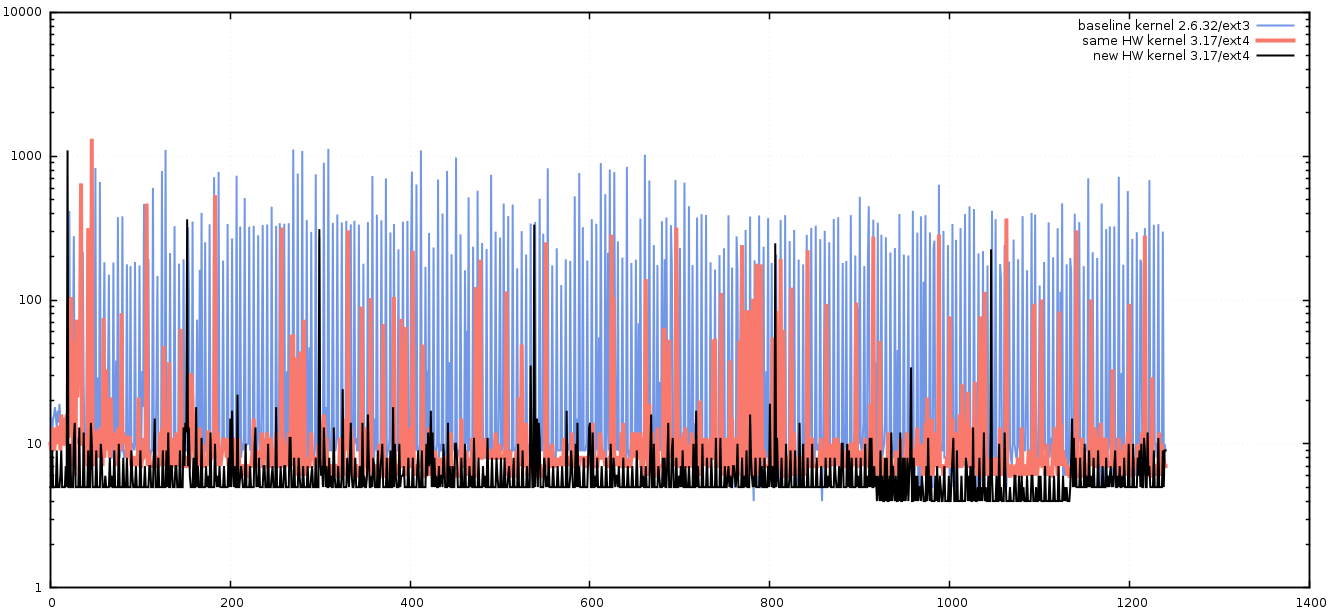
Although we knew that we were planning to upgrade to new hardware, when performance testing, it is always advisable to change only one thing at a time, otherwise it’s impossible to know what single change had any benefit or detrimental impact. With this methodology in mind, we first decided to upgrade the kernel, then file-system using the same hardware, each time recording the results. For brevity’s sake, I’ll present the outcome of those tests – we found that the best combination using the old hardware was to upgrade the kernel to a more recent version (3.17), and to use the ext4 file-system in place of ext3. The results of these changes was obvious when we re-ran the previous test.
Further improvements
We have also spent very little time experimenting with kernel tunables related to I/O performance, there may be further gains to be made by working on I/O schedulers and priorities.
Conclusion
A modern kernel on commodity hardware seems to be capable of write latencies as low as 5 microseconds when asynchronous I/O is used.
Once again, the importance of being able to replay production-like inputs to our system has proven invaluable in testing and tuning for performance in a repeatable manner. Having this ability means that we are able to try out different settings without impacting the performance of our production environments, and generate faster feedback on these changes.