So far we have:
- Talked about the regulations and how we might solve this with Linux software
- Built a “PTP Bridge” with Puppet
- Started recording metrics with collectd and InfluxDB, and
- Finished recording metrics
- Drawn lots of graphs with Grafana and found contention on our firewall
- Tried a dedicated firewall for PTP
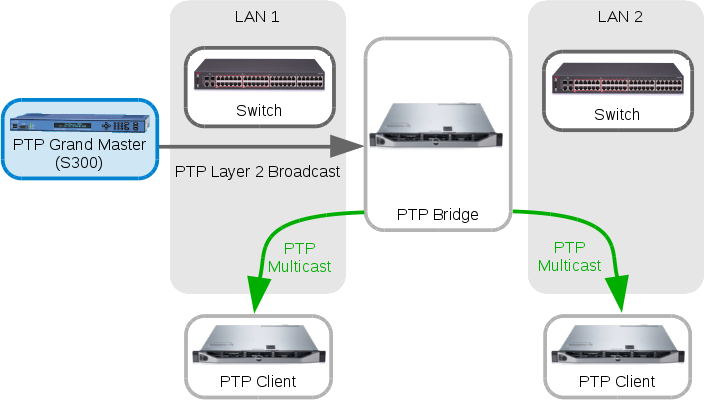
Multicast out multiple interfaces
My PTP clients are now receiving PTP multicast, but they are not getting any Delay Responses back:
2016-03-15 18:03:44.968187: warning: failed to receive DelayResp for DelayReq sequence number 0
2016-03-15 18:03:45.280687: warning: failed to receive DelayResp for DelayReq sequence number 1
2016-03-15 18:03:45.843188: warning: failed to receive DelayResp for DelayReq sequence number 2
2016-03-15 18:03:45.843201: warning: failed to receive DelayResp 3 times in hybrid mode. Reverting to multicast mode.
Another thing is a client on one network is getting the multicast from both interfaces, which should be impossible as there shouldn’t be any multicast routing or Rendezvous Point here, but our symptoms suggest there still is:
17:59:31.057579 IP 192.168.0.4.319 > 224.0.1.129.319: UDP, length 44
17:59:31.057626 IP 192.168.0.4.320 > 224.0.1.129.320: UDP, length 44
17:59:31.261173 IP 192.168.1.4.319 > 224.0.1.129.319: UDP, length 44
17:59:31.261227 IP 192.168.1.4.320 > 224.0.1.129.320: UDP, length 44
The double multicast feeds are messing with the client – it will only be able to Unicast back to one of them (the one on the local subnet) so the sfptpd daemon is rightly getting confused about who it’s master should be. The Best Master Clock algorithm won’t help in this circumstance as the clients are only able to communicate to one of the Masters by design, and the BMC algorithm is probably telling them to use the wrong one.
A quick look around our older software firewall that we used a few blog posts ago shows that we’ve still got RP config on there and the firewall is doing IGMP Querying on various subnets. Turning this off stops the second flow of multicast, but it also cuts off our local flow; the switch has stopped forwarding multicast to the clients. The switch also says it knows nothing about any PTP multicast group membership.
We always turn on IGMP Snooping here, so the switch maintains a list of ports to forward multicast to rather than broadcast out all multicast packets on the local subnet. The issue above arises because there’s no IGMP Querier on the subnet any more – it used to be the firewall but we’ve turned that off – so the switch doesn’t “know” where to send the multicast any more. We have an old home-grown fix for this, a little daemon written in C that we call ‘igmpqd’ that periodically broadcasts out IGMP Queries to force all the clients to reply. If we configure and start igmpqd on the PTP Bridge, very soon we have our switch aware of multicast group membership and PTP is flowing again.
The graphs below show a few minutes of offset tolerance from both clients. The top set is PTP through the ASIC firewall from my last post, the bottom set is the switch-only design:
The results look good, ±2μs is the best I’ve seen so far. The results look even better if you take a look over several hours:
Once again the top graph through the ASIC firewall, and the bottom is our most recent results through just a switch. What’s immediately apparent is the large reduction in spikes when we’re not running through the firewall.
Before we jump to any conclusions (or go running to the Networking team with a big “I told you so” grin on our faces), lets remind ourselves that we’ve had to use two different clients than what we had before. While the clients themselves are the same hardware as each other at this moment, they are different to the previous pair of clients. They are in the same rack though, so they are not physically further away than the previous clients (think switch hops).
The last big thing that could be different is the way the clients were configured – without having the old clients in front of me now it’s impossible to tell whether they were actually busy running something that was interfering with our results, rather than idle. Looking at the new results I now have a sneaking suspicion that my previous clients were in fact running some part of our production workload. The down side of doing this work on the cheap without a dedicated test bed is you risk running into these repeatability problems…
Anyway, we have some evidence (whether it is as credible as it looks or not) to support the theory that the switch only design is “better”. but why are we not a lot closer to the 100ns accuracy that the PTP Bridge is reporting it’s getting from the Grand Master Clock?
Running with Wrong Assumptions
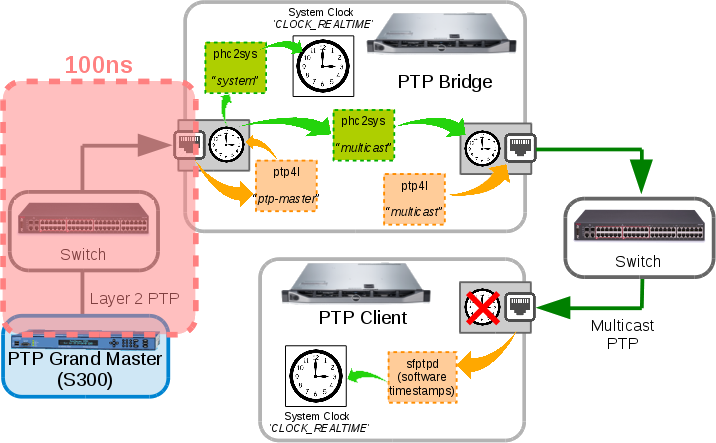
As you can see the 100ns in ingress is only a small part of the system. This does not account for the time spent synchronising the ingress PTP Hardware Clock time to other interface PHCs, and it’s during these times that we can be hit by scheduling delays or other interruptions. The phc2sys program outputs statistics for this though, so let’s look.
Here’s a sample of the output from one of the “multicast” phc2sys processes, which is reading from the PHC that is receiving PTP from the grand master and writing to the PHC that is sending multicast to the client:
phc2sys[11830930.330]: phc offset -11 s2 freq +34431 delay 4959
phc2sys[11830931.330]: phc offset 1 s2 freq +34439 delay 5327
phc2sys[11830932.331]: phc offset -27 s2 freq +34412 delay 5711
phc2sys[11830933.331]: phc offset 1 s2 freq +34431 delay 5599
phc2sys[11830934.331]: phc offset 21 s2 freq +34452 delay 4895
phc2sys[11830935.331]: phc offset -120 s2 freq +34317 delay 5695
Hardware Timestamping on a Client
I’ve wanted to try hardware timestamps on a client for a while now. It might also bring the design closer to sub microsecond accuracy. There is a development branch of PTPd that supports the Linux PHC API on bonded interfaces, so we’re going to give it a go. Building it into an RPM is pretty easy, there’s an rpmbuild wrapper script provided. If you are going to try it out I would suggest you add –enable-runtime-debug to the ./configure lines in the RPM Spec file, this allows you to set to various levels of debug logging in the configuration file.
To get this done very quickly I haven’t done any Puppet work for PTPd, it’s all configured by hand (gasp!). I will do it later when I try PTPd as the replacement software on the PTP Bridge. Turning off sfptpd and turning on ptpd is simple – just need to set which interface, the mode, and turn on stats logging, the rest of the defaults in /etc/ptpd.conf are fine:
ptpengine:interface=bond1
ptpengine:ip_mode=hybrid
global:statistics_file=/var/log/ptpd.stats
With the daemon running it is consuming multicast PTP from the PTP Bridge. There is a statistics file that reports the most recent metrics in a nice to read format, however at the moment I prefer to plot every data point, so will be looking at the statistics log, which is in CSV format:
2016-04-01 15:38:44.759881, slv, 001b21fffe6fa06c(unknown)/1, 0.000000000, 0.000012141, 0.000000000, 0.000024282, 550.827026367, S, 05623, 0.000000000, 0, 0.000000000, 0 0.000024282, 0.000000000
It uses my custom Collectd types, and converts from PTPd’s unit of seconds into nanoseconds. This is purely a cosmetic thing – Grafana is good at upscaling metrics (if you have 1000ms it will say 1s) but bad at downscaling (0.00000012s is hard to read).
There’s a small side affect with using Collectd’s Exec plugin, it wakes up every second, which end up sending multiple data points per second all at the same time, rather than an even spacing of 4 Sync messages per second. This is not a huge problem because a lot of the Grafana graphs will do an implicit Mean() over a given time period, and my Tolerance graphs use Min() and Max() functions. If we ever look at the raw data though it would look rather strange. I keep saying I will move away from Collectd, but the streaming-style Exec plugin is a just too easy to use at the moment.
Delay Messages, and PTP on cheap NICs
Interference
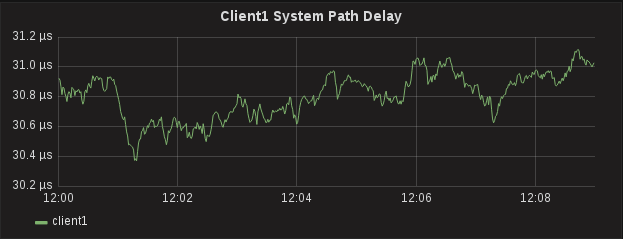
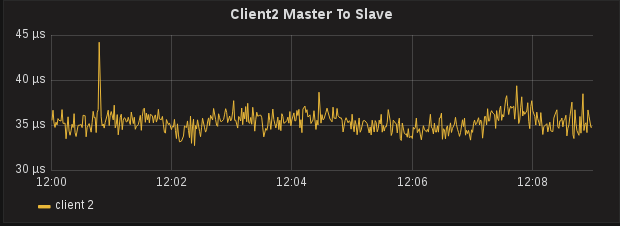
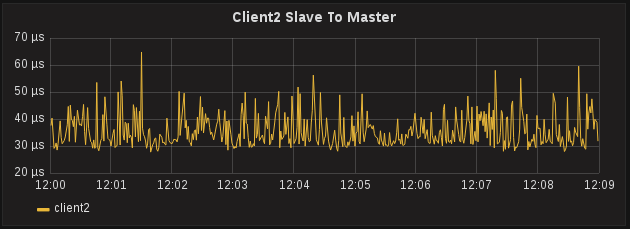
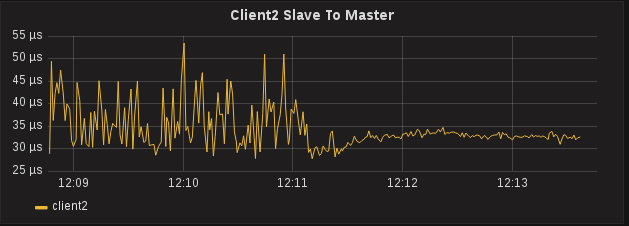
PTPd gives you a little bit more information that sfptpd. It will report the Master to Slave offset and the Slave to Master offset, which are the two offsets used to calculate One Way Delay (which is reported by sfptpd as Path Delay). While the values of these two metrics are largely useless when looked at individually, compared together and over a period of time can indicate a problem with PTP. After collecting metrics for a few minutes, an interesting pattern started to emerge regarding the Slave to Master offset.
Hardware Timestamps on a Client, Actually
Terminology and Language
What’s Next?
- PTPd to sync Solar Flare cards – we want to make sure we can receive accurate PTP over a cheap NIC and sync the clocks of expensive Solar Flare capture cards in the same server.
- Failure monitoring and recovery – we’ve seen PTPd work well, what if it fails? It’s infeasible to constantly watch hundreds of graphs – how do we alarm about it? Can we recover nicely or automatically? Can we somehow revert to NTP if we’re in trouble?
- PTP Bridge Resiliency – the PTP Bridge currently uses a mix of linuxptp software (ptp4l and phc2sys), can we use PTPd to replace this and get a little resiliency from bonded interfaces? What if the Bridge dies?


