 |
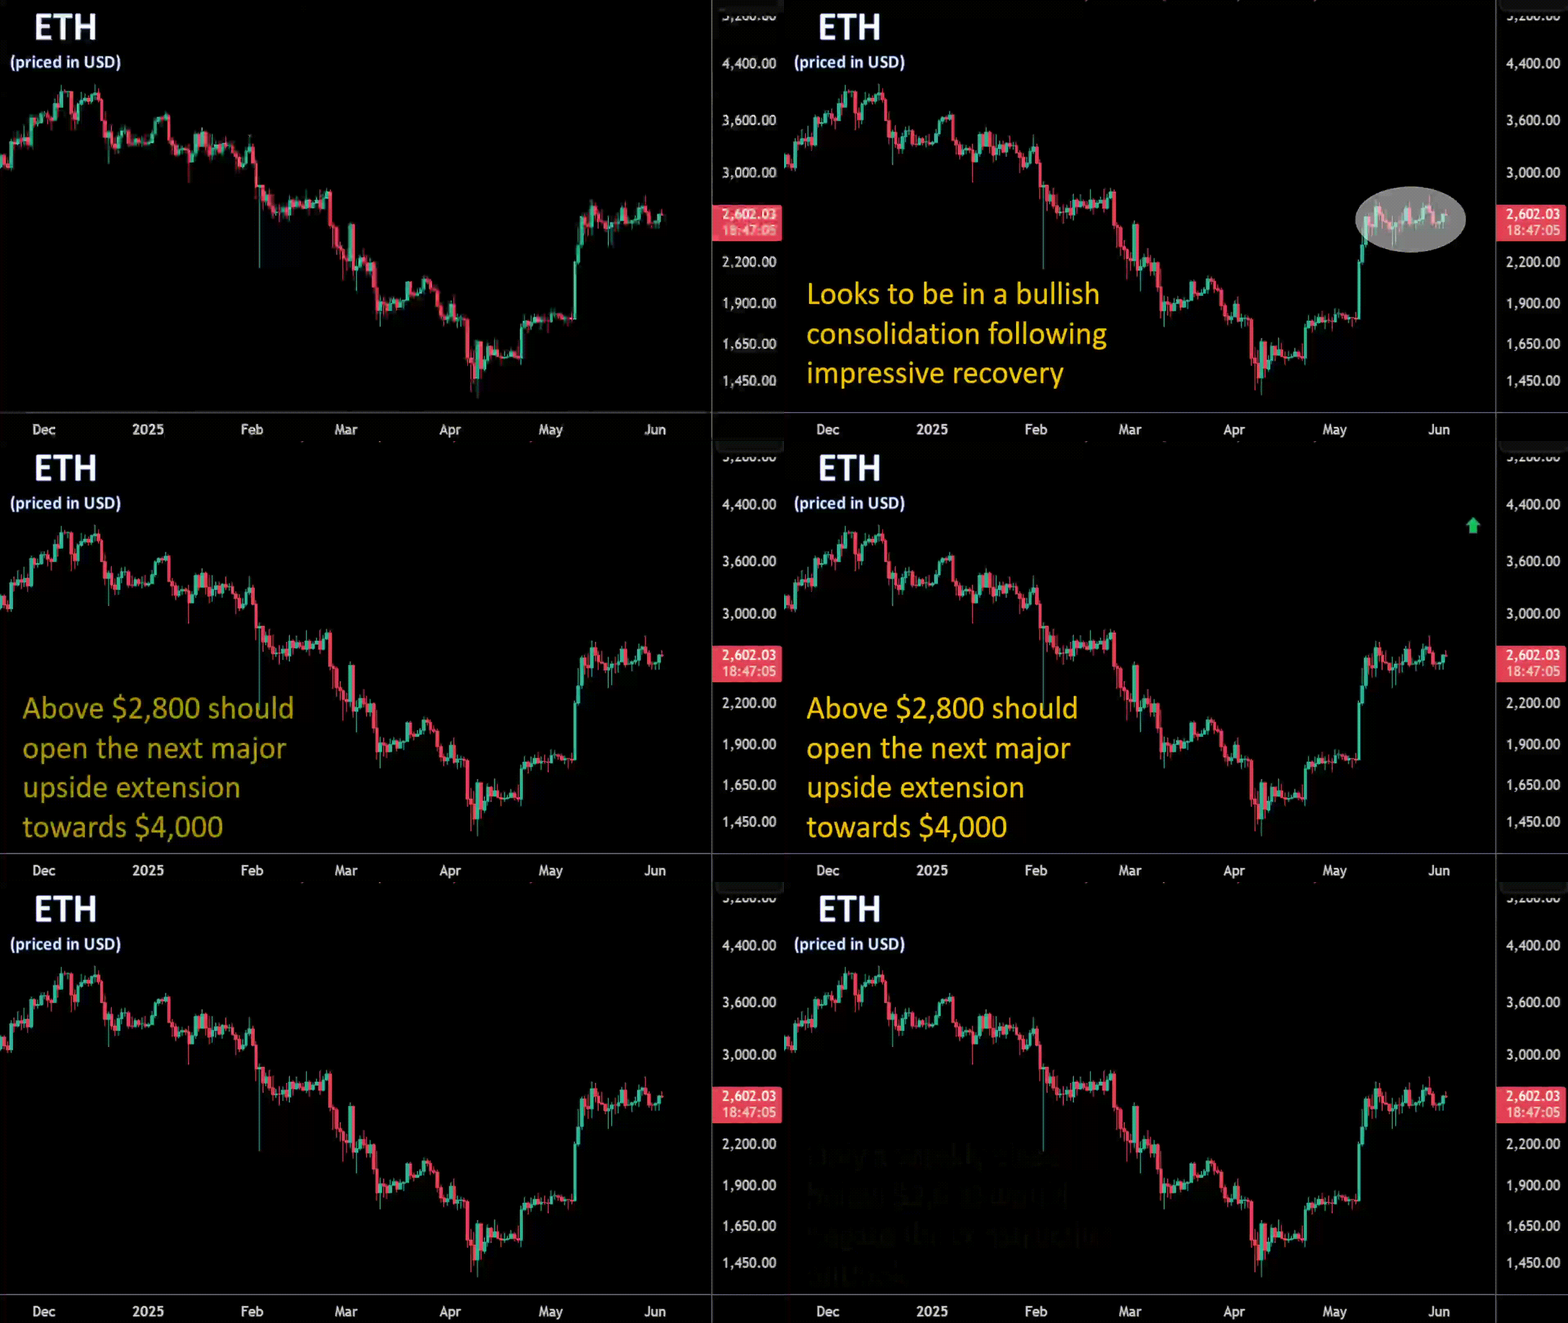
| 3 June 2025 ETH takes it turn at leading the charge |
| LMAX Digital performance |
|
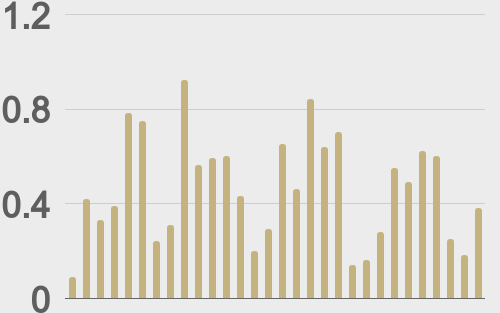
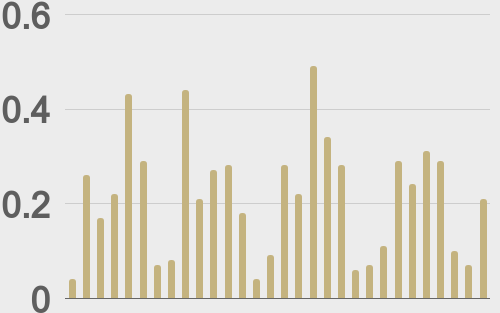
LMAX Digital volumes got off to a slow start this week. Total notional volume for Monday came in at $378 million, 18% below 30-day average volume. Bitcoin volume printed $205 million, 4% below 30-day average volume. Ether volume came in at $81 million, 29% below 30-day average volume. Looking at average position size over the past 30 days, we’re seeing average bitcoin position size at $10,455 and average position size for ether at $3,228. Bitcoin volatility continues to be rather subdued, just off recent yearly low levels, while ETH volatility is consolidating after trending up from its yearly low in May. We’re looking at average daily ranges in bitcoin and ether of $2,733 and $132 respectively. |
| Latest industry news |
|
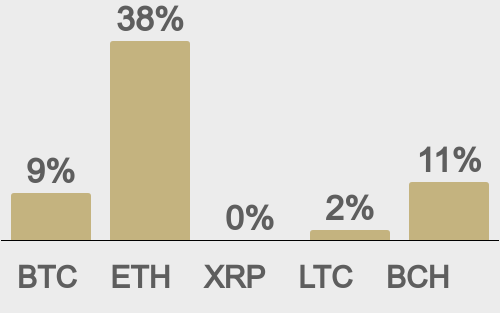
The cryptocurrency market has elegantly overcome its early-year hurdles, gaining strong momentum through Q2 and set to close the quarter on a high note following an impressive April and May. Bitcoin reached a new all-time high in May, closing the month up over 10%, while ETH shone brightly, soaring nearly 40% amid renewed investor optimism. Favorable regulatory advancements, including clearer US guidelines for crypto custody and ETF approvals, have significantly strengthened confidence, further supported by an improved sentiment in traditional risk assets, fueled by easing tariff concerns and sustained expectations of Federal Reserve rate cuts. Two key developments this quarter have amplified the market’s upward trajectory. Investors are increasingly appreciating bitcoin’s ability to stand independently, often outperforming when equities face pressure, solidifying its role as a portfolio hedge and alternative investment. Additionally, ETH’s strong outperformance relative to bitcoin, with signs of a potential bottom in May, points to a promising shift; historical patterns indicate that declining bitcoin dominance frequently sparks broader demand across the crypto asset class, fostering an optimistic outlook for the market’s future. As far as seasonality goes, bitcoin’s historical June performance since 2016 shows a modest average gain of +0.25%, making it the second-worst performing month, suggesting limited upside without fresh catalysts. However, this may not be all bad given the attention that is flowing towards ETH. |
| LMAX Digital metrics | ||||
| Price performance last 30 days avg. vs USD (%) |
||||
 |
||||
| Total volumes last 30 days ($bn) |
||||
 |
||||
| BTCUSD volumes last 30 days ($bn) |
||||
 |
||||
| BTCUSD avg. trade size last 30 days ($k) |
||||
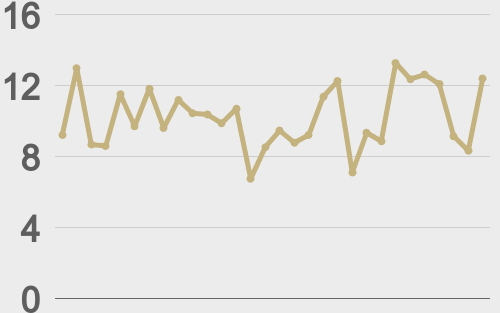 |
||||
| ETHUSD avg. trade size last 30 days ($k) |
||||
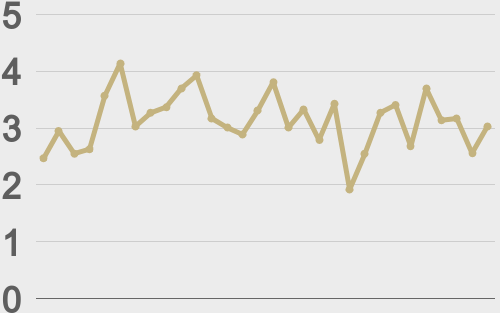 |
||||
| Average daily range | ||||
|
||||
 |
||||
|
@TheBlock__ |
||||
|
@TheBlock__ |
||||
| Crypto Bulletin sign-up | ||||
| Subscribe | ||||


