


 | ||
| 8th October 2025 | view in browser | ||
| Fed’s next moves eyed amid shutdown | ||
| The global financial landscape is navigating a complex interplay of currency dynamics, political uncertainties, and monetary policy shifts. The U.S. dollar, despite a long-term bearish outlook, is showing signs of short-term strength, driven by technical support and a potential short squeeze as the yen and euro weaken due to political instability in Japan and France. | ||
| Performance chart 30day v. USD (%) | ||
 | ||
| Technical & fundamental highlights | ||
| EURUSD: technical overview | ||
| The Euro has broken out from a multi-month consolidation off a critical longer-term low. This latest push through the 2023 high (1.1276) lends further support to the case for a meaningful bottom, setting the stage for a bullish structural shift and the next major upside extension targeting the 2021 high at 1.2350. Setbacks should be exceptionally well supported ahead of 1.1300. | ||
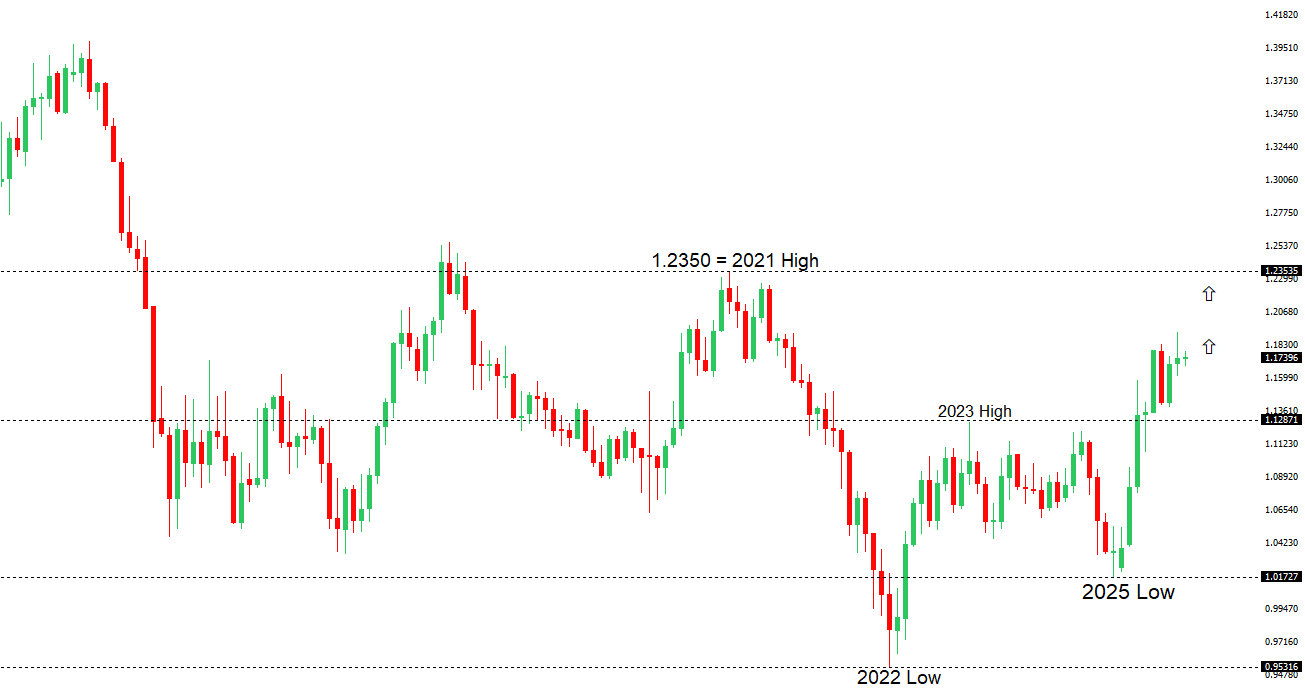 | ||
| R2 1.1919 - 16 September/2025 high -Strong R1 1.1779 - 1 October high - Medium S1 1.1600 - Figure - Medium S2 1.1574 - 27 August low - Strong | ||
| EURUSD: fundamental overview | ||
| The euro may face short-term pressure if French parliamentary elections are called before year-end due to Prime Minister Lecornu’s resignation, potentially delaying its momentum, though analysts believe this won’t derail its overall uptrend. The European Central Bank is likely to maintain its current policy unless the crisis significantly impacts Eurozone-wide economic activity or financial stability. Historical data and analyst views from major US banks suggest that French political turmoil typically causes only temporary euro weakness, with broader economic factors quickly regaining influence. ECB President Christine Lagarde emphasizes the need for bold reforms to strengthen the euro’s global role, while recent German factory data highlights ongoing manufacturing challenges, with a surprise 0.8% drop in August orders despite resilient domestic demand. | ||
| USDJPY: technical overview | ||
| There are signs of a meaningful top in place after the market put in a multi-year high in 2024. At this point, the door is now open for a deeper setback below the 2024 low at 139.58, exposing a retest of the 2023 low. Rallies should be well capped below 155.00. | ||
 | ||
| R2 154.80 - 12 February high - Strong R1 152.65 - 8 October high - Medium S1 150.20 - 7 October low - Medium S2 149.03 - 6 October low - Strong | ||
| USDJPY: fundamental overview | ||
| Despite market expectations of aggressive monetary and fiscal policies from Japan’s Sanae Takaichi, her lack of parliamentary majority and reliance on centrist coalition partners like Komeito may lead to more moderate policies than anticipated. Public concerns over inflation and pressure from international partners, particularly the U.S., could further temper her nationalist and reflationary agenda, potentially scaling back fiscal stimulus and monetary easing. Recent Japanese economic data shows a slowdown in wage growth to 1.5% in August, but steady base salary increases and a strong current account surplus signal resilience, supporting the Bank of Japan’s cautious policy normalization. | ||
| AUDUSD: technical overview | ||
| There are signs of the potential formation of a longer-term base with the market trading down into a meaningful longer-term support zone. Only a monthly close below 0.5500 would give reason for rethink. A monthly close back above 0.7000 will take the big picture pressure off the downside and strengthen case for a bottom. | ||
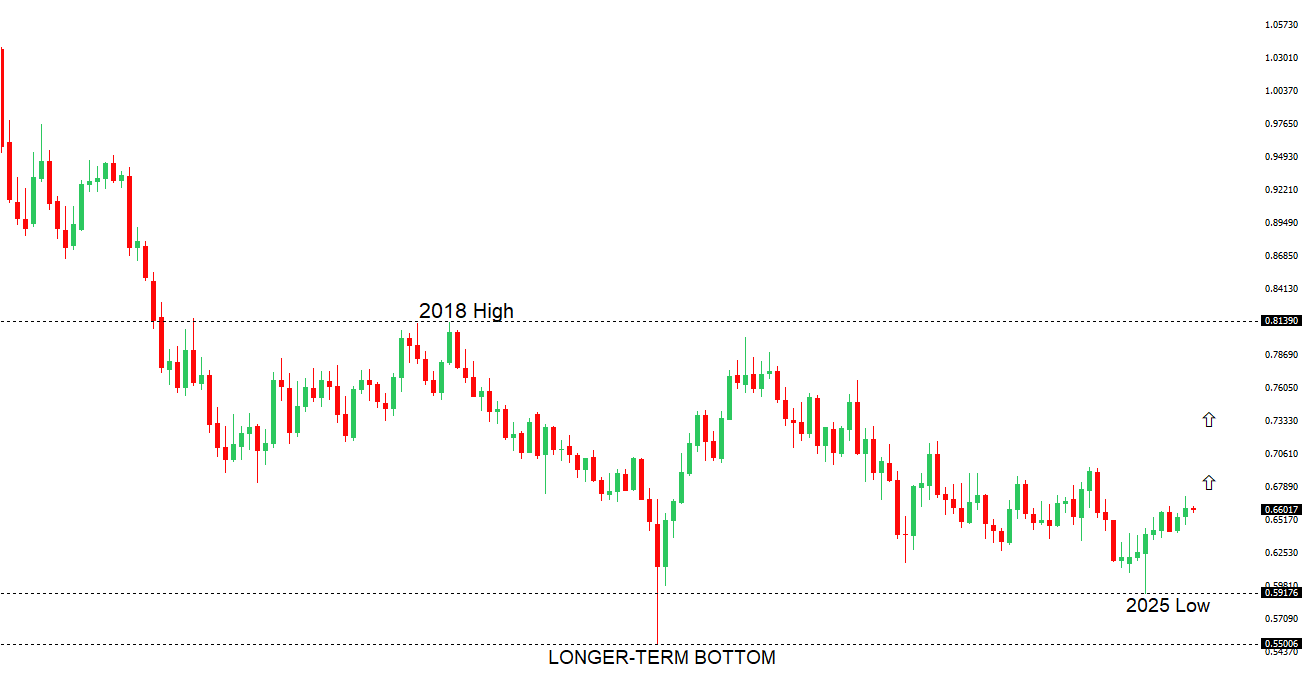 | ||
| R2 0.6707 - 17 September/2025 high - Strong R1 0.6660 - 18 September high - Medium S1 0.6520 - 26 September low - Medium S1 0.6483 - 2 September low - Strong | ||
| AUDUSD: fundamental overview | ||
| Australian consumer confidence has hit a six-month low, with the Westpac Consumer Confidence Index dropping 3.5% to 92.1, driven by the Reserve Bank of Australia’s hawkish stance and renewed inflation concerns. Job advertisements fell 3.3% in September, but consumers remain optimistic about employment prospects. Markets expect a cautious RBA, reducing the likelihood of a November rate cut to 37%, while some economists predict a 25bps cut to 3.35% and another in 2026, though a hawkish minority warns of potential rate hikes if inflation persists. The Australian dollar is gaining strength due to a slower RBA easing cycle compared to expected U.S. Federal Reserve cuts, with forecasts suggesting it could reach 70 US cents by mid-2026. | ||
| Suggested reading | ||
| No BLS Report: Best News Investors Have Gotten, J. Calhoun, Alhambra (October 5, 2025) What Are Circular AI Chip Deals? Should We Worry?, B. Colello, Morningstar (October 6, 2025) | ||