


 | ||
| 15th January 2026 | view in browser | ||
| Dollar steady as markets digest calm from Washington | ||
| The dollar stays firm as markets take comfort from a calmer tone out of Washington, softer oil and cooling metals, while investors brace for a packed global data slate and closely watch signs of labor market softening and currency stability in Asia. | ||
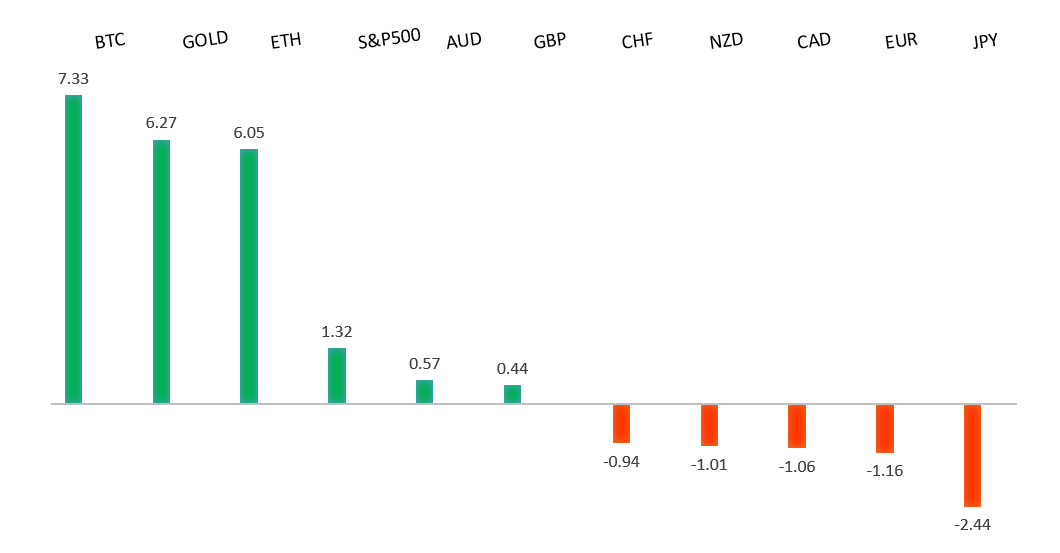
| Performance chart 30day v. USD (%) | ||
 | ||
| Technical & fundamental highlights | ||
| EURUSD: technical overview | ||
| The Euro outlook remains constructive with higher lows sought out on dips in favor of the next major upside extension targeting the 2021 high at 1.2350. Setbacks should be exceptionally well supported ahead of 1.1400. | ||
 | ||
| R2 1.1919 - 17 September/2025 high -Strong R1 1.1765 - 2 Janaury/2026 high - Medium S1 1.1618 - 9 January /2026 low - Medium S2 1.1615 - 9 December low - Strong | ||
| EURUSD: fundamental overview | ||
| The Euro is consolidating, remaining under mild one-month pressure despite a supportive 200-day moving average. Major banks stay constructive on the medium-term outlook, expecting a move above 1.20 in 2026 as eurozone growth stabilizes and the dollar weakens, though January seasonality points to near-term consolidation or a modest pullback. ECB officials say inflation is on track around 2% but warn that global uncertainty and trade tensions are weighing on growth, while Germany’s GDP data this week is expected to confirm an economy stuck near stagnation. | ||
| USDJPY: technical overview | ||
| There are signs of a meaningful top in place after the market put in a multi-year high in 2024. At this point, rallies should be well capped ahead of 160.00 ahead of a fresh down-leg back towards the 2024 low at 139.58. A break below 154.39 will strengthen the outlook. | ||
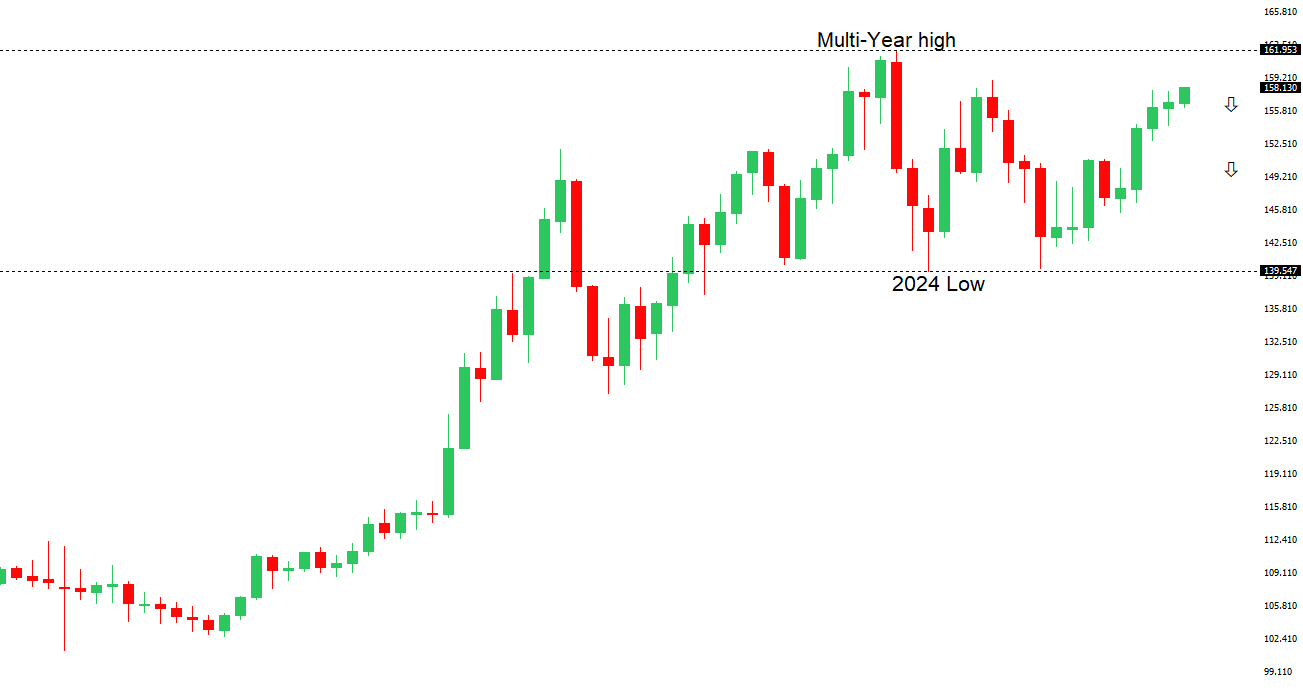 | ||
| R2 160.00 - Psychological - Strong R1 159.46 - 14 January /2026 high - Medium S1 157.52 - 12 January low - Medium S2 156.11 - 5 January/2026 low - Strong | ||
| USDJPY: fundamental overview | ||
| The yen is struggling to hold recovery gains after officials stepped up intervention rhetoric. Markets see a potential early election and a strong showing for Takaichi as reinforcing the reflationary “Takaichi trade” of higher yields and a weaker yen, with some calling for a move toward 160 or higher, though much of that story already looks priced in. While a decisive win could still see USDJPY test the 160–162 area, risks are two-sided: a narrow victory, a more cautious policy tone, or a hawkish BOJ or dovish Fed could trigger consolidation or even a sharp yen rebound. | ||
| AUDUSD: technical overview | ||
| There are signs of the potential formation of a longer-term base with the market trading down into a meaningful longer-term support zone. Only a monthly close below 0.5500 would give reason for rethink. A monthly close back above 0.7000 will take the big picture pressure off the downside and strengthen case for a bottom. | ||
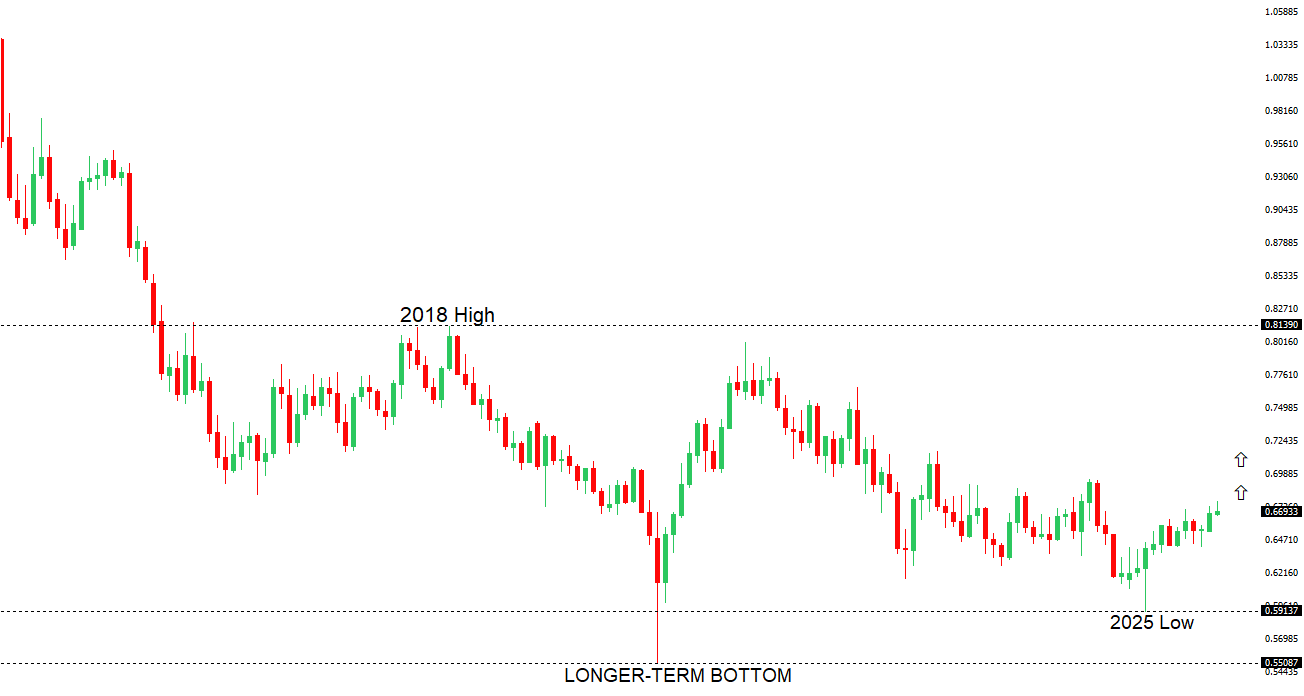 | ||
| R2 0.6800 - Figure - Medium R1 0.6767 - 7 January/2026 high - Medium S1 0.6660 - 31 December low - Medium S2 0.6592 - 18 December low - Strong | ||
| AUDUSD: fundamental overview | ||
| The Australian dollar edged lower as domestic data softened, with inflation expectations easing slightly and bond yields dipping, reinforcing the view that the RBA is likely to keep rates on hold for now. Job vacancies continue to fall but at a much slower pace, signalling stabilizing labor conditions. Markets see only modest odds of a rate hike before mid-2026, with upcoming employment and inflation data set to be key. In the US, expectations for Fed cuts remain but are increasingly data-dependent, keeping investors cautious amid rising geopolitical risks. | ||
| Suggested reading | ||
| Killing the Goose that Lays the Golden Egg, J. Wiggins, Behavioral Investment (January 13, 2026) It’s the End of the World as We Know It—and the Market Feels Fine, A. Salzman, Barron’s (January 9, 2026) | ||