


 | ||
| 21st January 2026 | view in browser | ||
| Bonds, borders and central banks | ||
| Global markets open the day on edge as Japan’s bond turmoil, rising US–Europe trade tensions and looming tariff risks, and a renewed inflation focus in the UK collide with heavy global bond supply, fragile growth expectations, and increasingly divergent central bank paths across the US, Europe, and Asia. | ||
| Performance chart 30day v. USD (%) | ||
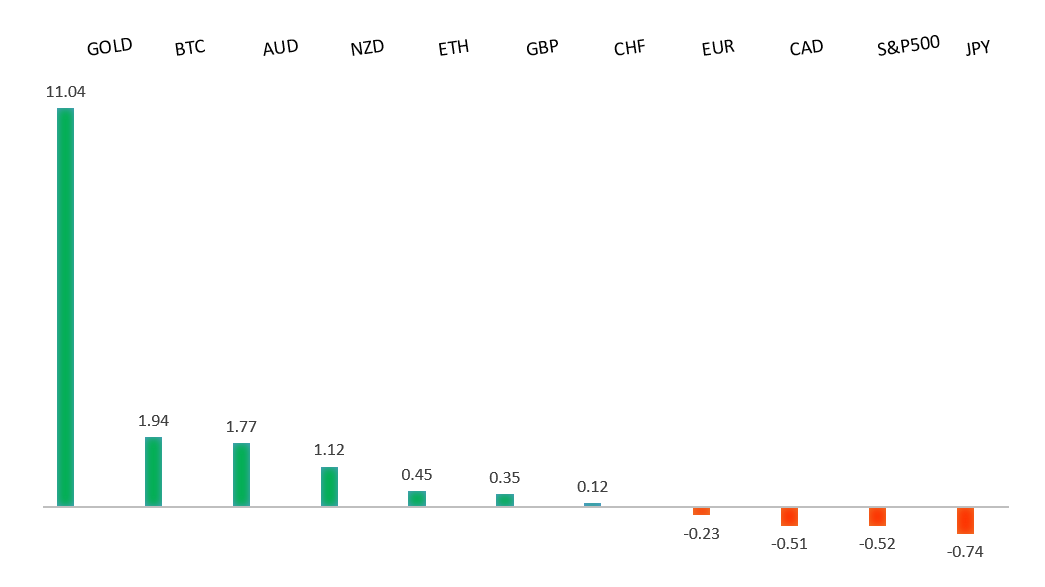 | ||
| Technical & fundamental highlights | ||
| EURUSD: technical overview | ||
| The Euro outlook remains constructive with higher lows sought out on dips in favor of the next major upside extension targeting the 2021 high at 1.2350. Setbacks should be exceptionally well supported ahead of 1.1400. | ||
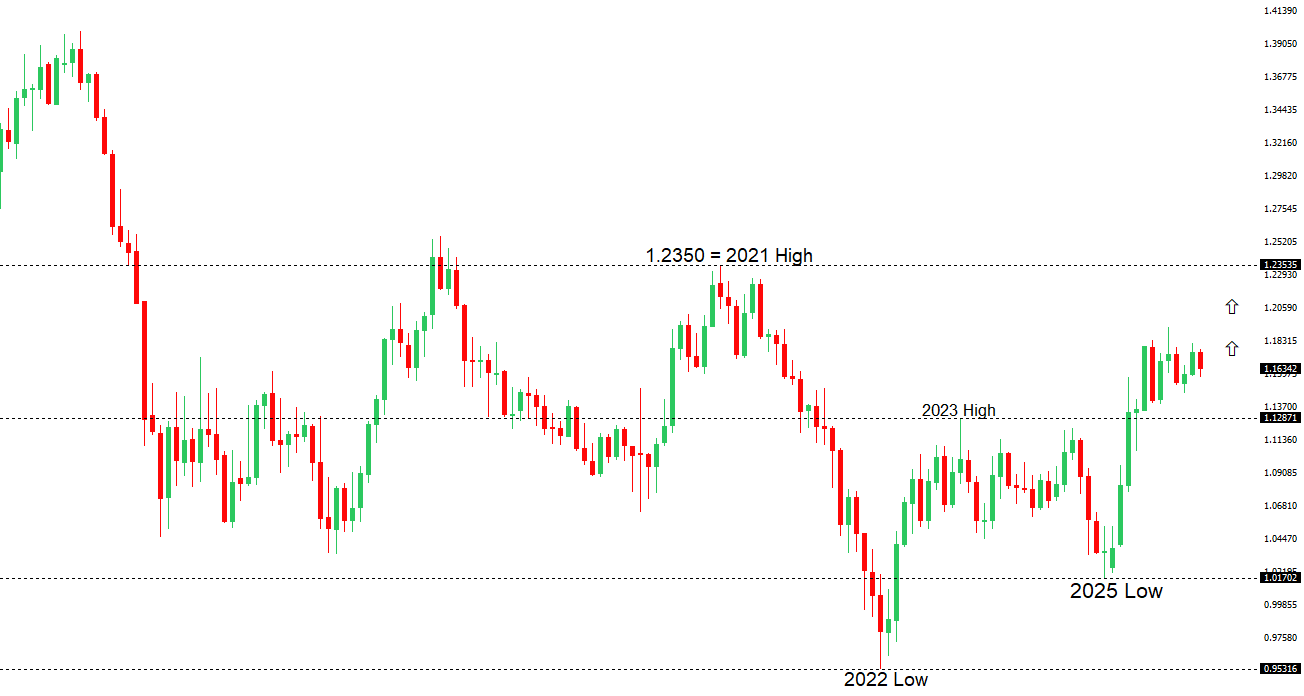 | ||
| R2 1.1808 - 24 December high -Strong R1 1.1769 - 20 Janaury high - Medium S1 1.1632 - 20 January low - Medium S2 1.1577 - 19 January /2026 low - Strong | ||
| EURUSD: fundamental overview | ||
| The euro eased after the prior session’s rally, but remains supported by a sharp jump in Germany’s ZEW expectations index to its highest level since mid-2021, reflecting optimism around large fiscal programs and the view that 2026 could mark a turning point for Europe’s economy. ECB officials signaled rates are likely to stay on hold with a mild easing bias, helping limit EUR downside, while Trump’s tariff threats and clashes with Europe have unsettled markets and raised longer-term risks for the dollar, highlighted by a Danish pension fund’s decision to exit its US Treasury holdings over policy concerns. | ||
| USDJPY: technical overview | ||
| There are signs of a meaningful top in place after the market put in a multi-year high in 2024. At this point, rallies should be well capped ahead of 160.00 ahead of a fresh down-leg back towards the 2024 low at 139.58. A break below 154.39 will strengthen the outlook. | ||
 | ||
| R2 160.00 - Psychological - Strong R1 159.46 - 14 January /2026 high - Medium S1 157.42 - 19 January low - Medium S2 156.11 - 5 January/2026 low - Strong | ||
| USDJPY: fundamental overview | ||
| The yen is holding relatively steady despite a difficult domestic backdrop marked by fiscal worries and election uncertainty. While weak fundamentals and politics continue to weigh on the currency, sharply rising JGB yields, growing expectations for BOJ rate hikes and the risk of FX intervention near 160 are making further dollar gains increasingly asymmetric over the next couple of weeks. Markets expect the BOJ to hold rates at its 23 January meeting, but with officials paying closer attention to yen weakness and inflation, any move through 160 could prompt either a policy shift or direct intervention, keeping volatility high. | ||
| AUDUSD: technical overview | ||
| There are signs of the potential formation of a longer-term base with the market trading down into a meaningful longer-term support zone. Only a monthly close below 0.5500 would give reason for rethink. A monthly close back above 0.7000 will take the big picture pressure off the downside and strengthen case for a bottom. | ||
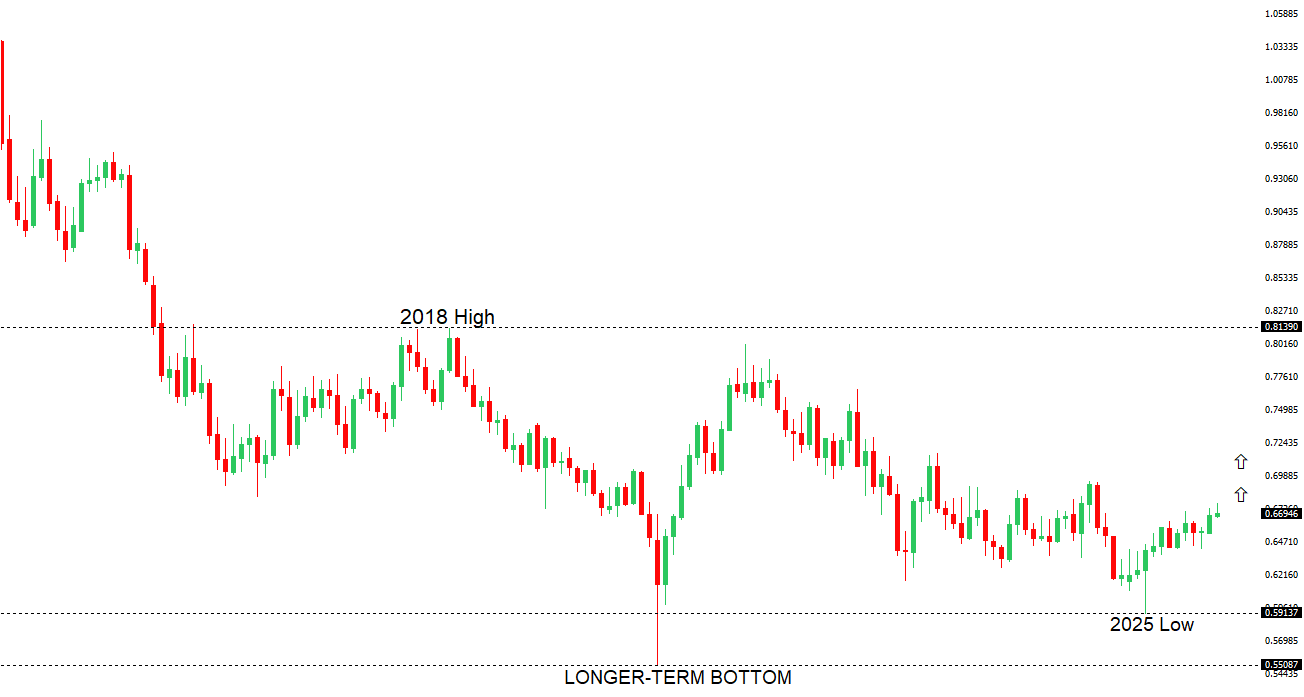 | ||
| R2 0.6800 - Figure - Medium R1 0.6767 - 7 January/2026 high - Medium S1 0.6660 - 31 December low - Medium S2 0.6592 - 18 December low - Strong | ||
| AUDUSD: fundamental overview | ||
| The Aussie dollar dipped slightly after retesting recent highs, as markets look ahead to Thursday’s labor data and a genuinely “live” February RBA meeting. Investors are pricing the most aggressive tightening path in G10 for 2026, contrasting with expected Fed cuts and underpinning AUD support, while domestic data point to resilient demand and still-elevated inflation. Bank forecasts are split on a February hike, and positioning shows specs remain net short but have covered sharply since November, suggesting consolidation ahead as traders wait for fresh catalysts. | ||
| Suggested reading | ||
| It’s About Avoiding Big, Irreversible Mistakes, C. Reilly, RiskHedge (January 19, 2026) Cheap S&P 500 Stocks That Can Cushion a Correction, M. Hulbert, Marketwatch (January 17, 2026) | ||