


 | ||
| 2nd March 2026 | view in browser | ||
| US Dollar advances, oil surges as conflict escalates | ||
| The US dollar is starting the week stronger as escalating tensions drive a flight to safety, oil prices surge on supply disruption fears, equities come under pressure, and markets brace for key manufacturing data and central bank commentary against a backdrop of heightened geopolitical uncertainty. | ||
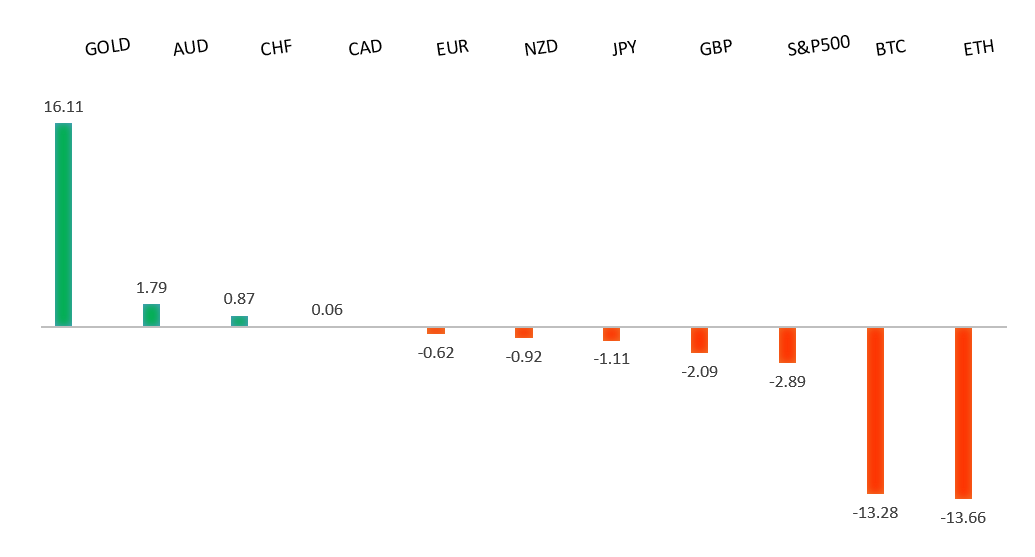
| Performance chart 30day v. USD (%) | ||
 | ||
| Technical & fundamental highlights | ||
| EURUSD: technical overview | ||
| The Euro outlook remains constructive with higher lows sought out on dips in favor of the next major upside extension targeting the 2021 high at 1.2350. Setbacks should be exceptionally well supported ahead of 1.1500. | ||
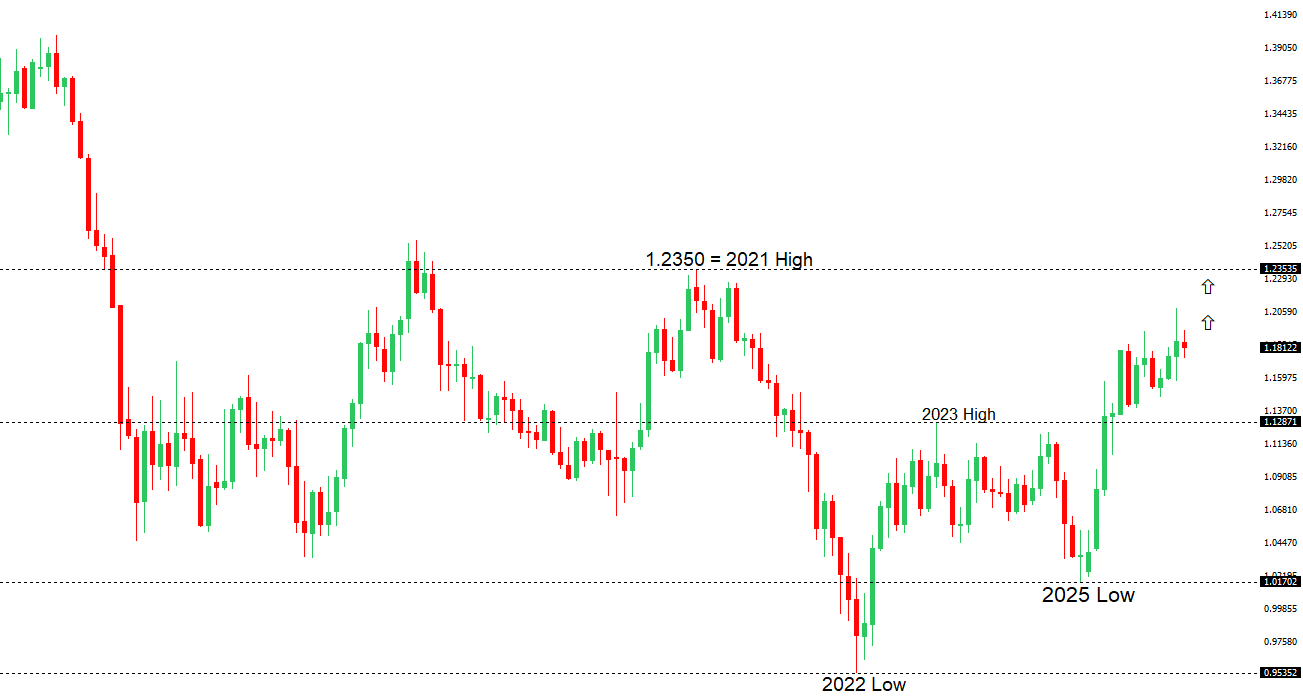 | ||
| R2 1.1929 - 10 February high - Strong R1 1.1835 - 23 February high - Medium S1 1.1700 - Figure - Medium S2 1.1670 - 22 January low - Strong | ||
| EURUSD: fundamental overview | ||
| The euro has come under notable pressure as dollar strength weighs amid elevated geopolitical tension. The euro was already under pressure after softer Eurozone inflation, raising the risk that further weakness in upcoming CPI data could revive expectations for ECB rate cuts. Near-term price action will be likely be driven more by risk sentiment and oil price swings than by economic releases. Overall, markets expect choppy trading, with downside risks if tensions escalate or inflation disappoints, while stabilization in geopolitics and data could allow modest upside. | ||
| USDJPY: technical overview | ||
| There are signs of a meaningful top in place after the market put in a multi-year high in 2024. At this point, rallies should be well capped ahead of 160.00 in favor of a fresh down-leg back towards the 2024 low at 139.58. The recent break below 154.39 strengthens the outlook. | ||
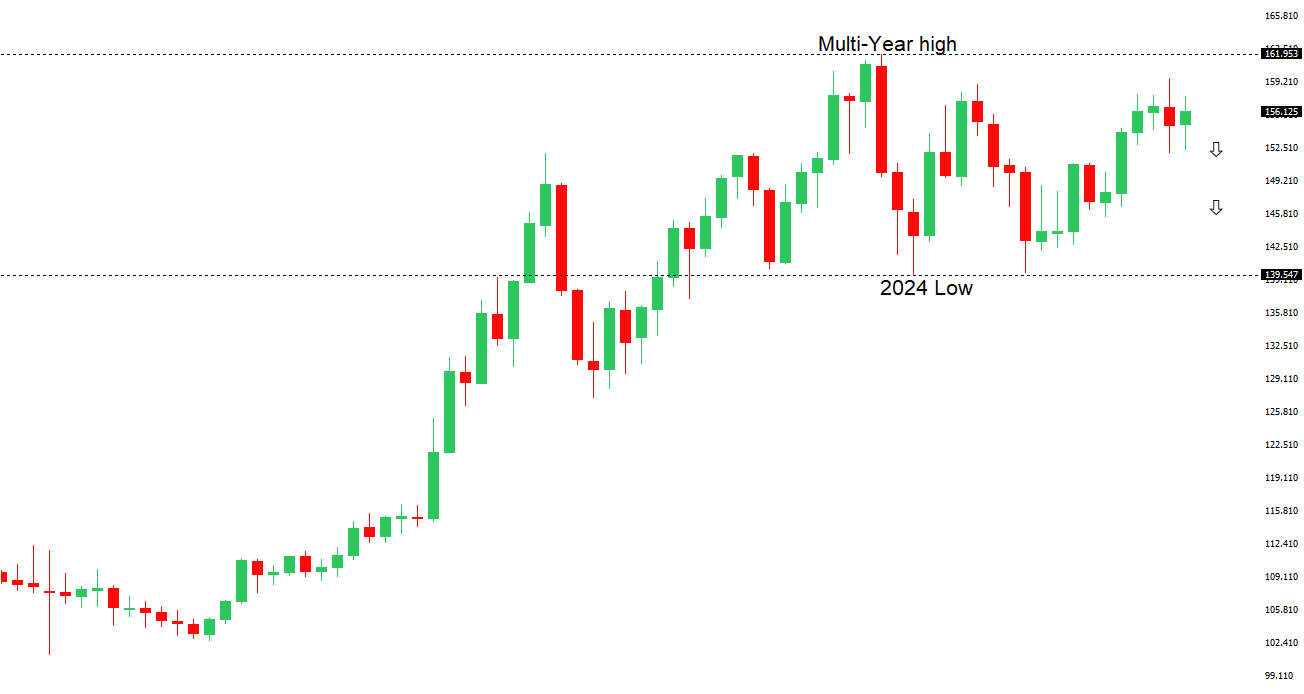 | ||
| R2 157.66 - 9 February high - Strong R1 157.05 - 2 March high - Medium S1 154.00 - 23 February low - Medium S2 151.97 - 28 January/2026 low - Strong | ||
| USDJPY: fundamental overview | ||
| The yen has softened against the dollar despite a broader risk-off backdrop, even as stronger manufacturing PMI data points to improving domestic conditions and rising business confidence. While geopolitical tensions and safe-haven demand may offer intermittent support, structural factors—including capital outflows ahead of Japan’s fiscal year-end, elevated oil prices, and still-accommodative BOJ policy relative to the Fed—continue to limit sustained yen strength. Although gradual BOJ tightening and firm inflation dynamics support the yen over the medium term, near-term gains are likely to remain shallow amid wide rate differentials, cautious policy guidance, and persistent external pressures, leaving the currency vulnerable to continued two-way volatility. | ||
| AUDUSD: technical overview | ||
| There are signs of the formation of a longer-term base with the market recovering out from a meaningful longer-term support zone. A monthly close back above 0.7000 will take the big picture pressure off the downside and strengthen case for a bottom. Setbacks should now be well supported ahead of 0.6700. | ||
 | ||
| R2 0.7158 - 2023 high - Strong R1 0.7147 - 12 February/2026 high - Strong S1 0.7007 - 9 February low - Medium S2 0.6897 - 6 February low - Strong | ||
| AUDUSD: fundamental overview | ||
| The Australian dollar is weaker, pressured by safe-haven demand amid escalating US-Israel-Iran tensions, though supportive domestic data and strong commodity prices are providing some offset. If the conflict remains contained, volatility should ease and AUD could gradually recover, especially if Australian GDP and household spending surprise to the upside and reinforce signs of stabilizing growth. However, a deeper escalation that disrupts oil flows would likely strengthen the USD further and weigh on AUD, even if Australia’s commodity exposure offers some resilience, while only a rapid de-escalation would allow AUD to meaningfully re-rate higher in the near term. | ||
| Suggested reading | ||
| AI Hurtles Ahead, H. Marks, Oaktree Capital (February 28, 2026) 10 Cheap Dividend-Growth Stocks, S. Dziubinski, Morningstar (February 26, 2026) | ||