


 | ||
| 10th March 2026 | view in browser | ||
| Markets steady as oil pulls back from war spike | ||
| Markets are starting the day cautiously as oil prices retreat from a sharp geopolitical-driven spike, the dollar softens slightly, and investors await fresh developments on the Iran conflict alongside key global data and US macro releases. | ||
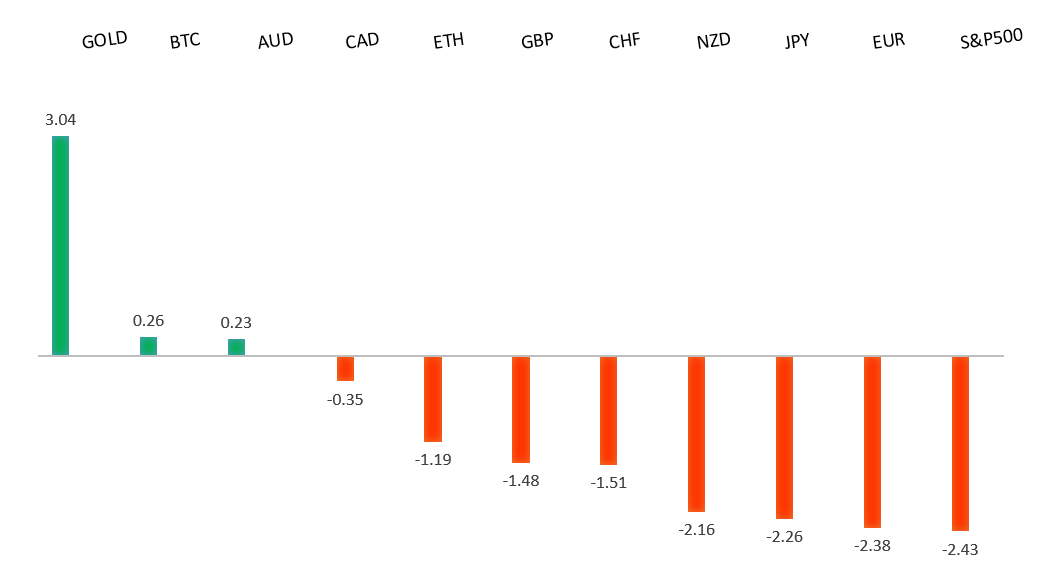
| Performance chart 30day v. USD (%) | ||
 | ||
| Technical & fundamental highlights | ||
| EURUSD: technical overview | ||
| The Euro outlook remains constructive with higher lows sought out on dips in favor of the next major upside extension targeting the 2021 high at 1.2350. Setbacks should be exceptionally well supported ahead of 1.1400. | ||
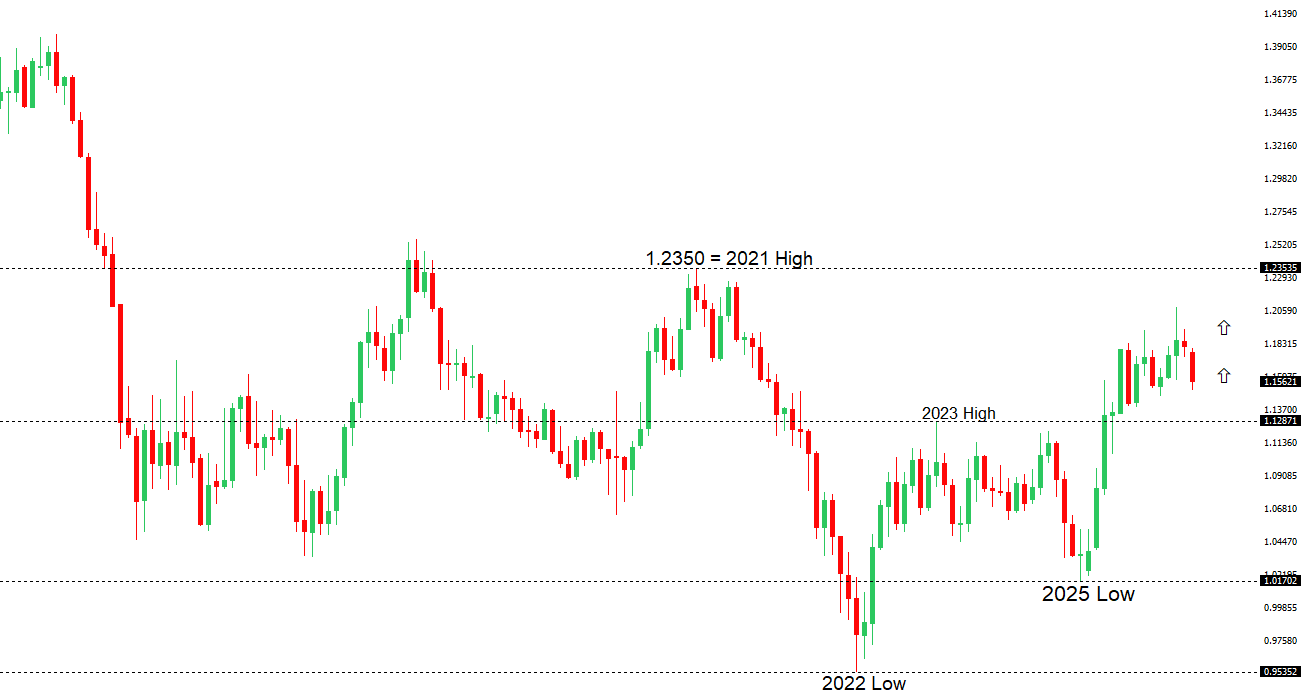 | ||
| R2 1.1707 - 3 March high - Strong R1 1.1655 - 4 March high - Medium S1 1.1507 - 9 March/2026 low - Medium S2 1.1469 - 5 November low - Strong | ||
| EURUSD: fundamental overview | ||
| The euro is consolidating Monday’s modest gains following a round of intense setbacks, as markets rapidly reprice the ECB outlook following another energy shock. With oil surging and European gas prices up significantly, traders are now pricing around 1–2 ECB rate hikes this year, pushing German yields higher but reviving concerns about Europe’s energy vulnerability and stagflation risks. While higher yields offer some limited support for the euro, the backdrop of fragile growth, weaker sentiment data, and tightening financial conditions suggests any rallies may be short-lived and heavily dependent on policy expectations and energy price dynamics rather than a strong economic recovery. | ||
| USDJPY: technical overview | ||
| There are signs of the formation of a meaningful top after the market put in a multi-year high in 2024. At this point, rallies should be well capped ahead of 160.00 in favor of a fresh down-leg back towards the 2024 low at 139.58. | ||
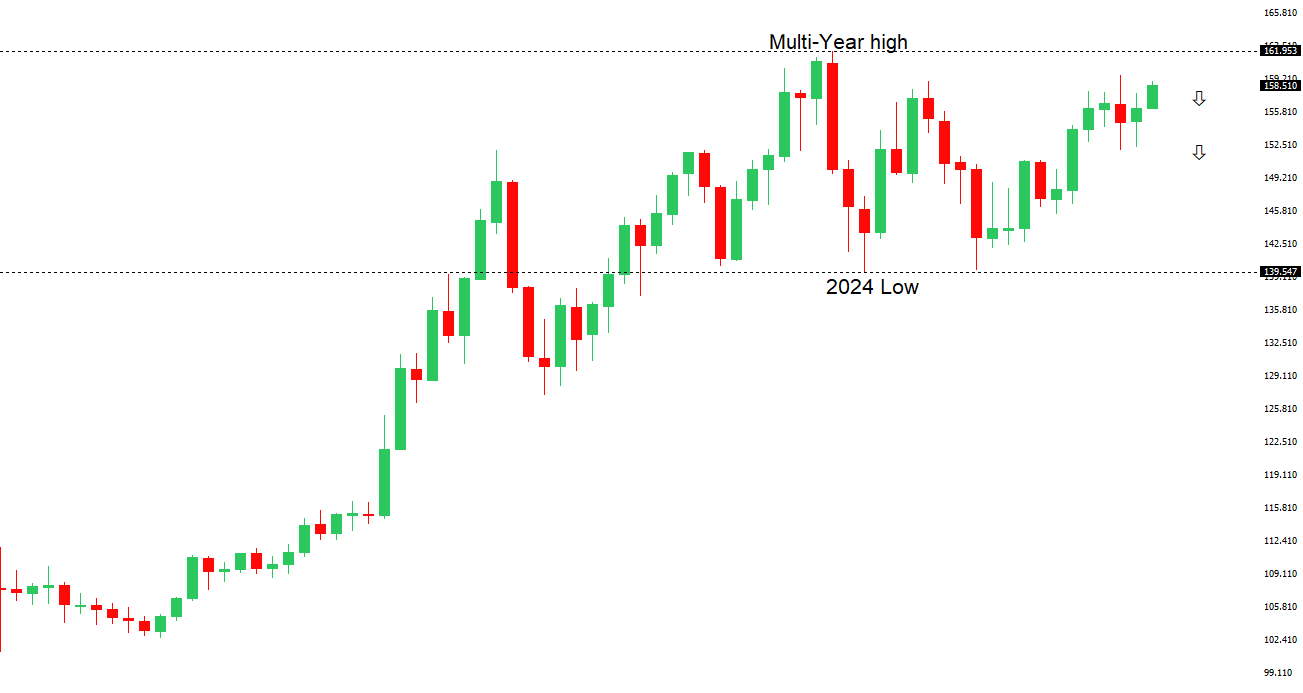 | ||
| R2 159.46 - 14 January/2026 high - Strong R1 158.91 - 9 March high - Medium S1 156.45 - 5 March low - Medium S2 155.34 - 25 February low - Medium | ||
| USDJPY: fundamental overview | ||
| The yen remains close to Monday’s roughly six-week low (USDJPY high) as Iran-related supply risks keep oil elevated, highlighting Japan’s worsening terms of trade. Because Japan imports most of its energy from the Middle East, higher oil prices threaten a stagflationary hit—squeezing growth while lifting inflation and eroding already weak real incomes. The yen is therefore caught between opposing forces: rising imported inflation and the possibility of earlier BOJ tightening on one side, and weaker growth, fiscal worries, and safe-haven USD demand on the other. Markets currently see only about a 50% chance of a BOJ hike by April, though some analysts warn USDJPY could drift toward the 160 intervention zone if expectations for tightening fade, while others argue the BOJ may instead bring forward rate hikes as higher oil pushes inflation further above target. | ||
| AUDUSD: technical overview | ||
| There are signs of the formation of a longer-term base with the market recovering out from a meaningful longer-term support zone. A monthly close back above 0.7000 will take the big picture pressure off the downside and strengthen case for a bottom. Setbacks should now be well supported ahead of 0.6700. | ||
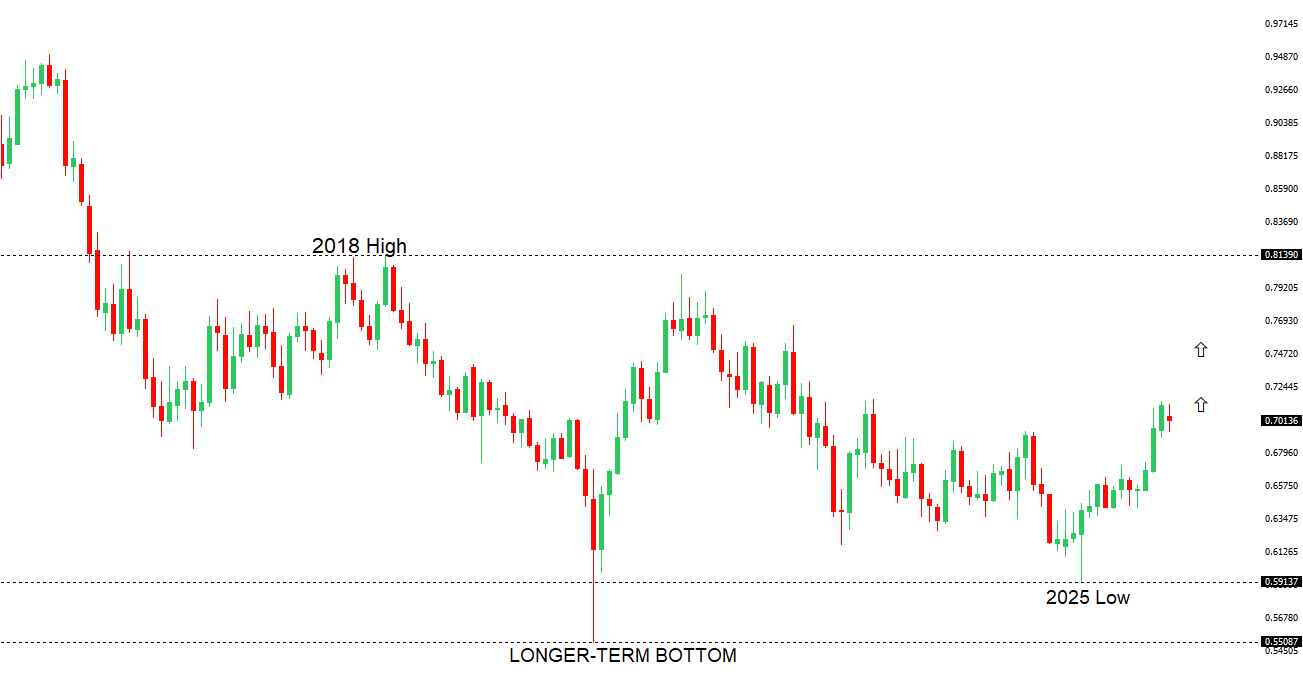 | ||
| R2 0.7158 - 2023 high - Strong R1 0.7147 - 12 February/2026 high - Strong S1 0.6944 - 3 March low - Medium S2 0.6897 - 6 February low - Strong | ||
| AUDUSD: fundamental overview | ||
| The Australian dollar has held up well into the latest dip. Australia is seeing mixed effects from the latest surge in global energy prices: higher LNG and coal prices are boosting export revenues and supporting the country’s terms of trade, which should provide some near-term support for the AUD. However, rising fuel import costs are pushing up inflation and weighing on household spending, likely slowing domestic growth. As a result, while stronger commodity exports may offer short-term resilience for the currency, softer economic momentum and cautious risk sentiment could limit sustained upside. | ||
| Suggested reading | ||
| The Fed Isn’t Independent, It Never Was, and It Doesn’t Matter, J. Tamny, Forbes (March 8, 2026) Crypto Coin Is Gobbling Up U.S. Treasuries, T. Smith, NY Times (March 8, 2026) | ||