


 | ||
| 24th September 2026 | view in browser | ||
| Strong growth, higher rates, harder choices | ||
| Strong US data and rising yields are lifting the dollar and weighing on equities, while renewed Middle East tensions push oil higher and keep inflation risks in focus. | ||
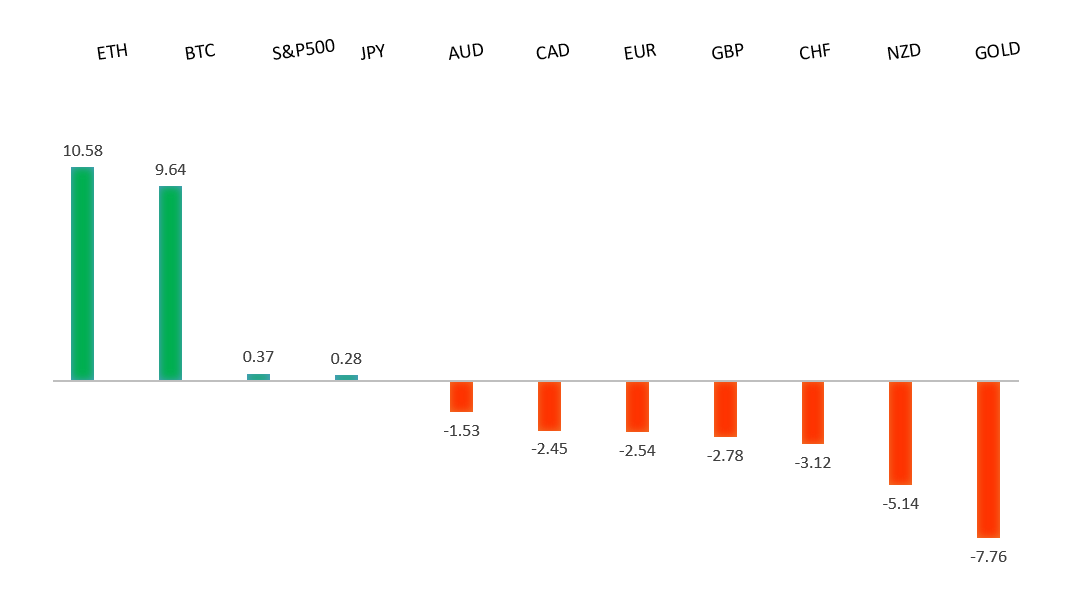
| Performance chart 30day v. USD (%) | ||
 | ||
| Technical & fundamental highlights | ||
| EURUSD: technical overview | ||
| The Euro outlook remains constructive with higher lows sought out on dips in favor of the next major upside extension targeting the 2021 high at 1.2350. Setbacks should be exceptionally well supported ahead of 1.1300. | ||
 | ||
| R2 1.1557 - 16 September high - Medium R1 1.1498 - 17 September high - Medium S1 1.1370 - 23 September low - Medium S2 1.1353 - 28 July low - Medium | ||
| EURUSD: fundamental overview | ||
| The euro remains under pressure against the dollar despite a strong September eurozone composite PMI reading of 53.1, its highest since April 2023. The survey points to improving activity and gives the ECB room to consider another rate increase, but it has done little to shift the relative policy outlook: the ECB’s deposit rate stands at 2.50%, while the Fed’s range is 3.75%–4.00%. Stronger US survey readings and expectations of further Fed tightening have kept the dollar supported, leaving EURUSD near its lowest level since late July. | ||
| GBPUSD: technical overview | ||
| The Pound remains exceptionally well supported on dips into the 1.3000 area, with the price largely consolidating above the psychological barrier and previous resistance turned support in the form of the 2023 high. Look for the market to continue be well supported on dips ahead of the next major upside extension through the yearly high at 1.3870 and towards a retest of the 2018 high at 1.4377 further up. Only a monthly close below 1.3000 negates. | ||
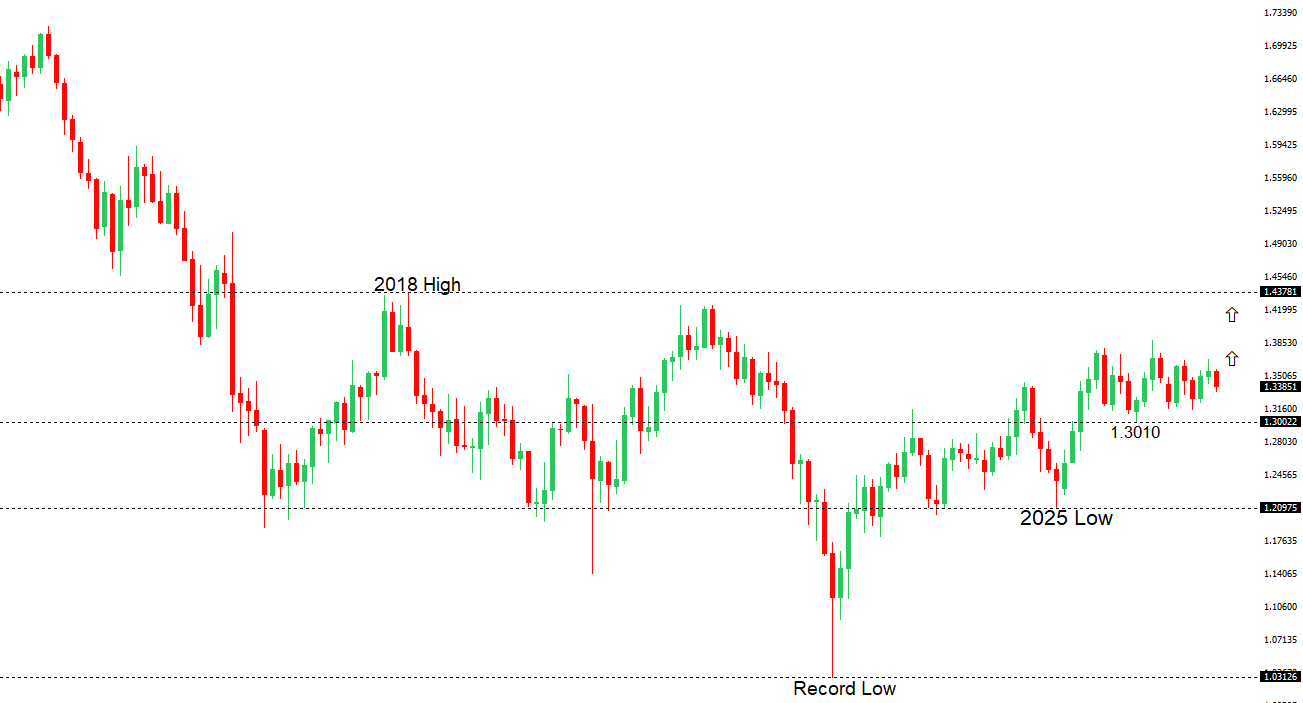 | ||
| R2 1.3407 - 17 September high - Medium R1 1.3300 - Figure - Medium S1 1.3223 - 23 September low - Medium S2 1.3200 - Figure - Strong | ||
| GBPUSD: fundamental overview | ||
| The pound has come under pressure as the latest surveys point to a widening gap between UK and US growth. UK services activity slowed to a three-month low in September, while the US services reading beat expectations sharply, reinforcing the dollar’s strength and the case for further Fed tightening. The Bank of England held rates at 3.75% last week, though three members voted for a hike, and faster price increases reported by UK services firms mean inflation remains a concern. For now, softer UK growth alongside a firmer US outlook is weighing on GBPUSD, even as UK price pressures limit the BoE’s room to ease. | ||
| USDJPY: technical overview | ||
| The recent breakdown below 155.00 suggests the market could be on the verge of a bigger structural shift, with the possibility for an end to a longer-term uptrend and the start to a period of persistent weakness. Critical support now comes in the form of the 2026 low from January at 151.97, with a drop below to strengthen the bearish outlook and open the door for a major downside extension targeting the 2024 low at 139.58. The market would need to get back above 160.00 to take the immediate pressure off the downside. | ||
 | ||
| R2 158.97 - 3 September high - Medium R1 158.40 - 23 September high - Medium S1 156.57 - 21 September low - Medium S2 155.33 - 17 September low - Medium | ||
| USDJPY: fundamental overview | ||
| The yen has given back much of its recent rally as the dollar benefits from stronger US data and growing expectations of another Fed rate hike. The Bank of Japan raised rates to 1.25% last week, but its divided vote and cautious guidance left investors uncertain about how quickly it will tighten again. That leaves a substantial US–Japan interest rate gap, which continues to weigh on the yen. USDJPY has moved back above 158, bringing the risk of further Japanese intervention into focus after Tokyo’s large yen purchases earlier this summer. | ||
| AUDUSD: technical overview | ||
| There are signs of the formation of a longer-term base with the market recovering out from a meaningful longer-term support zone. The latest monthly close back above 0.7000 takes the big picture pressure off the downside and strengthens the case for a bottom, with the focus now on a push towards 0.8000. Setbacks should now be well supported ahead of 0.6700. | ||
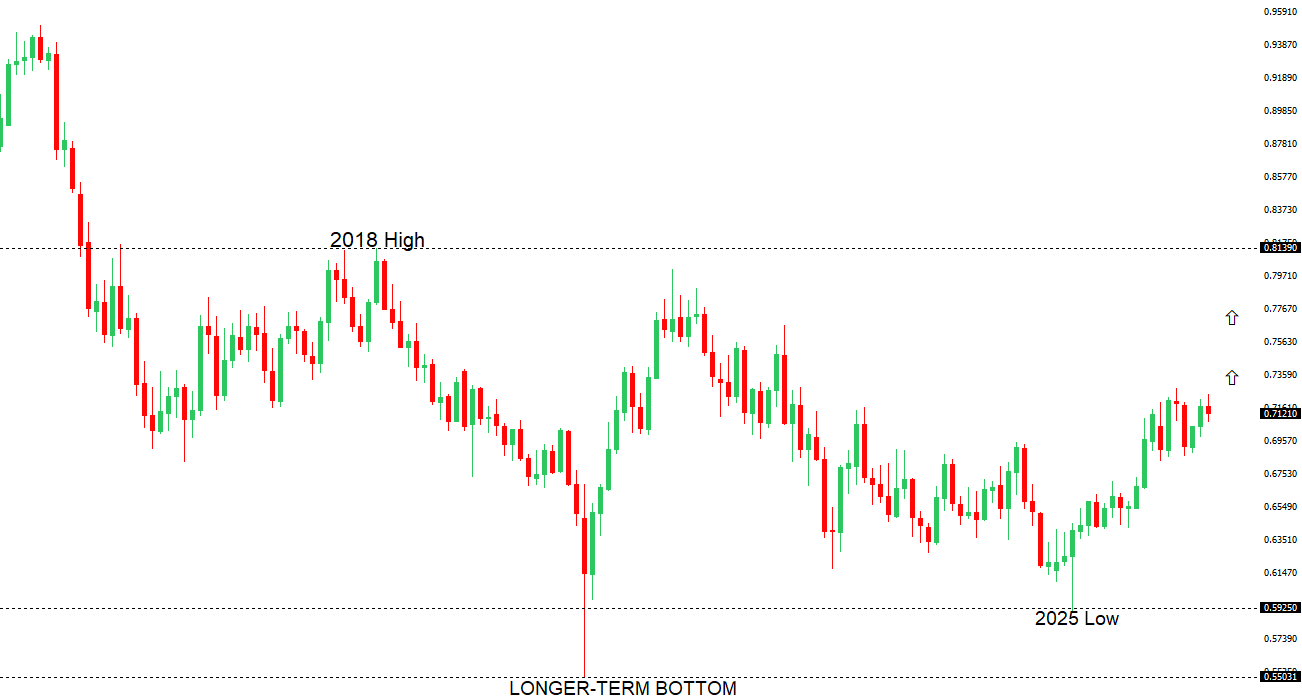 | ||
| R2 0.7142 - 15 September high - Strong R1 0.7100 - Figure - Medium S1 0.7026 - 23 September low - Medium S2 0.7000 - Psychological - Strong | ||
| AUDUSD: fundamental overview | ||
| The Australian dollar has been pulled between domestic rate support and a stronger US dollar. Persistent inflation has kept the RBA focused on the risk of further tightening, but softer September business surveys have raised questions about how much more the economy can absorb. At the same time, expectations of further Fed hikes have supported the US dollar and weighed on AUDUSD. Bessent’s reported extension of the US–China trade truce through January 10 offers some relief for the Australian dollar, given Australia’s exposure to Chinese demand, though it has yet to outweigh the pressure from the US rate outlook. | ||
| Suggested reading | ||
| How Will Berkshire Equities Be Run Without Warren Buffett?, A. Bary, Barron’s (September 22, 2026) If You Want to Bet on the End of the World, W. Cohan, Puck (September 21, 2026) | ||