


 | ||
| 8th October 2026 | view in browser | ||
| The gulf between optimism and risk | ||
| Markets head into Thursday on a more cautious footing as rising oil prices and a hawkish Fed outlook support the dollar and test the resilience of the global equity rally. | ||
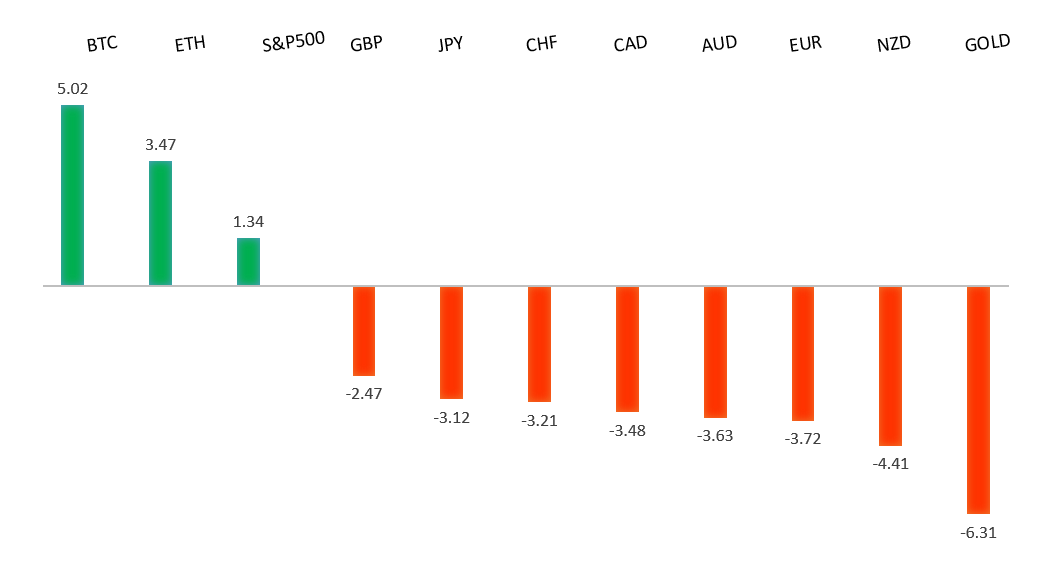
| Performance chart 30day v. USD (%) | ||
 | ||
| Technical & fundamental highlights | ||
| EURUSD: technical overview | ||
| The Euro continues to show signs of wanting to carve out a major bottom after trading down to a 20-year low in 2022. Setbacks should be exceptionally well supported above 1.1200 on a weekly close basis ahead of the next major upside extension back above 1.2000. | ||
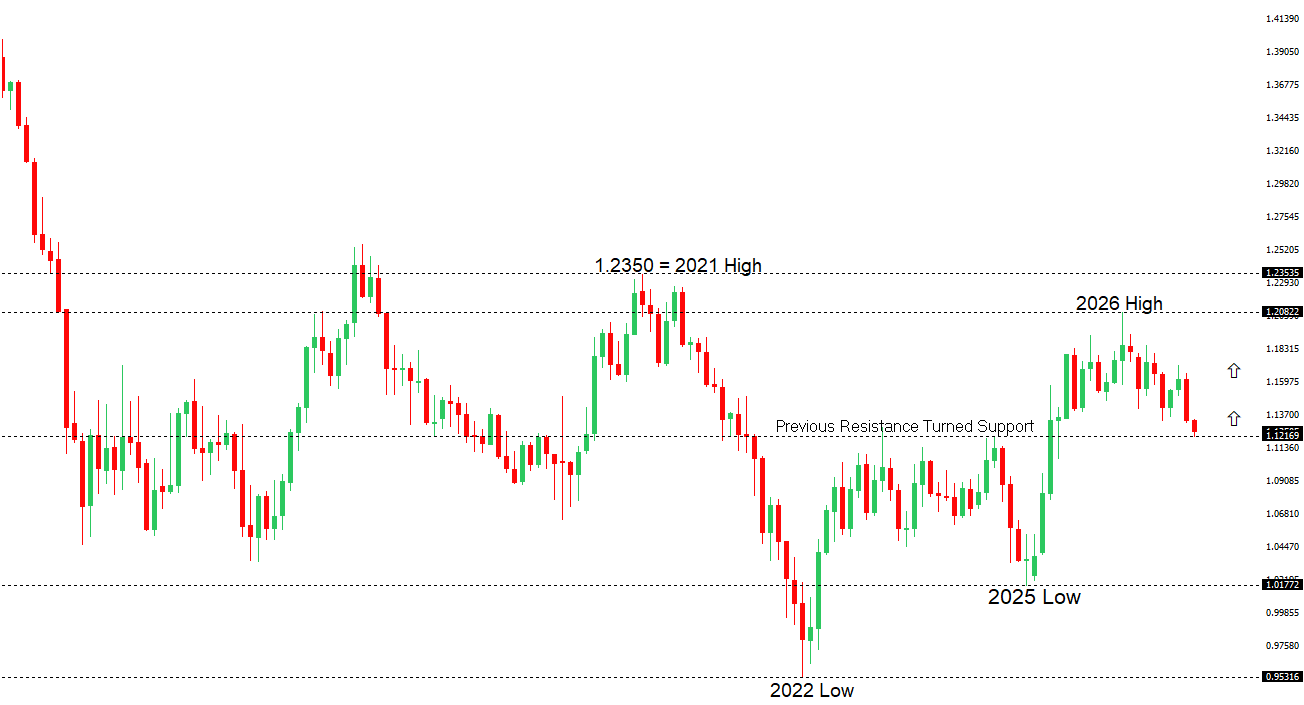 | ||
| R2 1.1337 - 1 October high - Medium R1 1.1286 - 2 October high - Medium S1 1.1161 - 4 Octoberber/2026 low - Strong S2 1.1100 - Figure - Strong | ||
| EURUSD: fundamental overview | ||
| The euro has recovered some ground as the dollar softens, but the fundamental backdrop remains challenging. France’s fiscal and political uncertainty is weighing on sentiment, with doubts over the government’s ability to deliver budget savings ahead of the presidential election raising concerns about sovereign debt pressures and potentially constraining further ECB tightening. Meanwhile, a widening US yield advantage continues to favor the dollar, reinforced by Fed minutes highlighting persistent inflation risks and hawkish commentary pointing to further tightening. Attention now turns to US jobless claims and additional Fed remarks, while any moderation in expectations for US rate increases could give the euro some breathing room. | ||
| GBPUSD: technical overview | ||
| The Pound remains exceptionally well supported on dips into the 1.3000 area, with the price largely consolidating above the psychological barrier and previous resistance turned support in the form of the 2023 high. Look for the market to continue be well supported on dips ahead of the next major upside extension through the yearly high at 1.3870 and towards a retest of the 2018 high at 1.4377 further up. Only a monthly close below 1.3000 negates. | ||
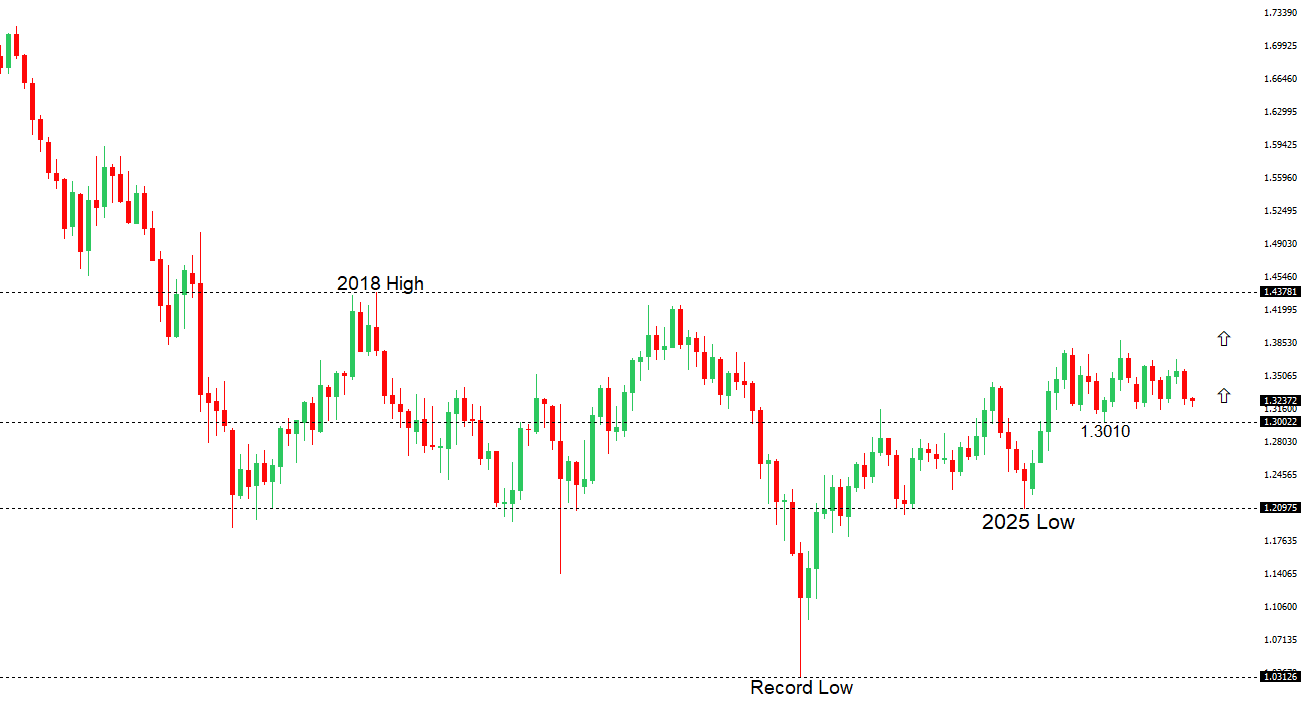 | ||
| R2 1.3407 - 17 September high - Medium R1 1.3312 - 30 September high - Medium S1 1.3181 - 1 October low - Medium S2 1.3140 - 24 June/2026 low - Strong | ||
| GBPUSD: fundamental overview | ||
| The pound remains under pressure into Thursday as a hawkish Federal Reserve outlook, elevated US bond yields and persistent geopolitical uncertainty underpin demand for the dollar. Expectations of tighter Bank of England policy offer sterling some support, but have so far been insufficient to offset the broader dollar strength. The key fundamental tension is whether UK rate expectations can provide a stronger cushion while US yields and demand for safety continue to favor the dollar, leaving sterling struggling to establish a sustained recovery. | ||
| USDJPY: technical overview | ||
| The recent breakdown below 155.00 suggests the market could be on the verge of a bigger structural shift, with the possibility for an end to a longer-term uptrend and the start to a period of persistent weakness. Critical support now comes in the form of the 2026 low from January at 151.97, with a drop below to strengthen the bearish outlook and open the door for a major downside extension targeting the 2024 low at 139.58. The market would need to get back above 160.00 to take the immediate pressure off the downside. | ||
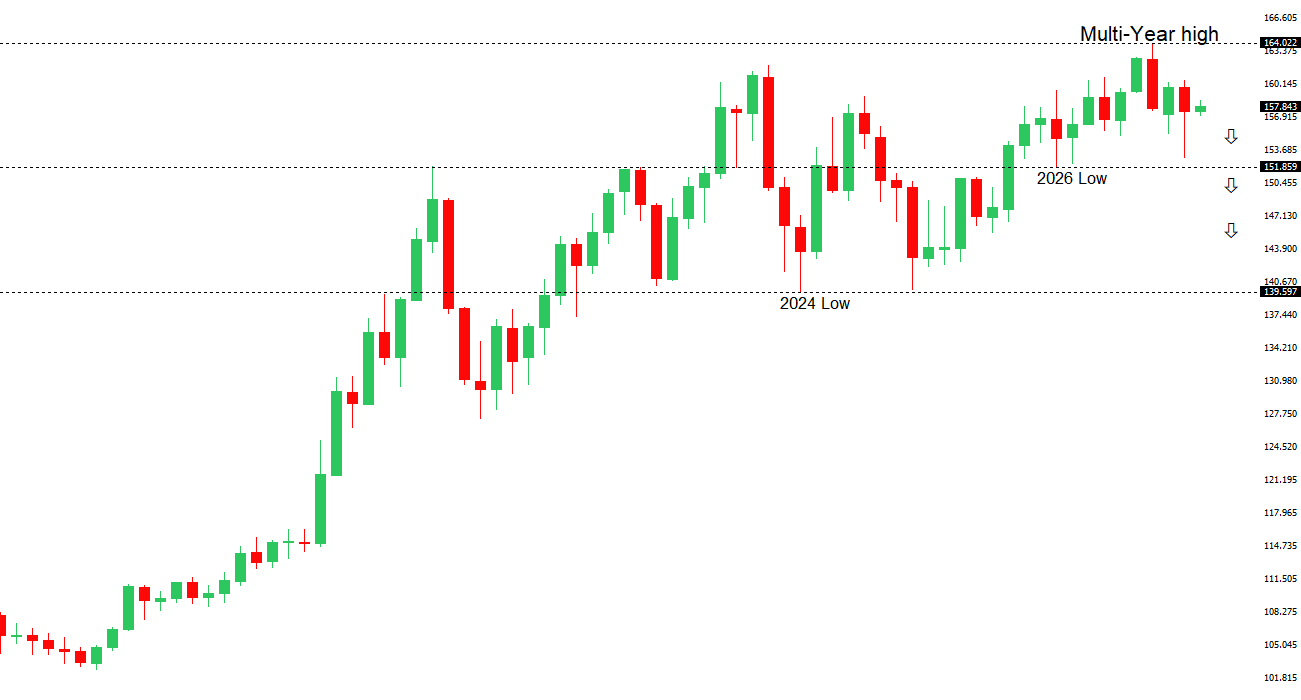 | ||
| R2 159.04 - 24 September high - Strong R1 158.52 - 7 October high - Medium S1 156.37 - 30 September low - Medium S2 155.33 - 17 September low - Medium | ||
| USDJPY: fundamental overview | ||
| The yen’s fundamental outlook remains tied to the timing of further Bank of Japan tightening, with the latest regional report reinforcing the case for additional rate increases while highlighting risks to the wage outlook. Unchanged assessments for seven of nine regions, resilient consumption, strong investment appetite and AI-related production demand suggest the economy continues to hold up. Meanwhile, sustained wage increases and more frequent price rises point to persistent inflation pressure, amplified by the weak yen and costs associated with the Middle East conflict. However, warnings that firms unable to pass on higher costs could restrain wage increases complicate the policy outlook. For the yen, the key question is whether these inflation pressures translate into faster tightening, with firmer expectations for rate increases offering potential support for the currency. | ||
| AUDUSD: technical overview | ||
| There are signs of the formation of a longer-term base with the market recovering out from a meaningful longer-term support zone. The latest monthly close back above 0.7000 takes the big picture pressure off the downside and strengthens the case for a bottom, with the focus now on a push towards 0.8000. Setbacks should now be well supported ahead of 0.6700. | ||
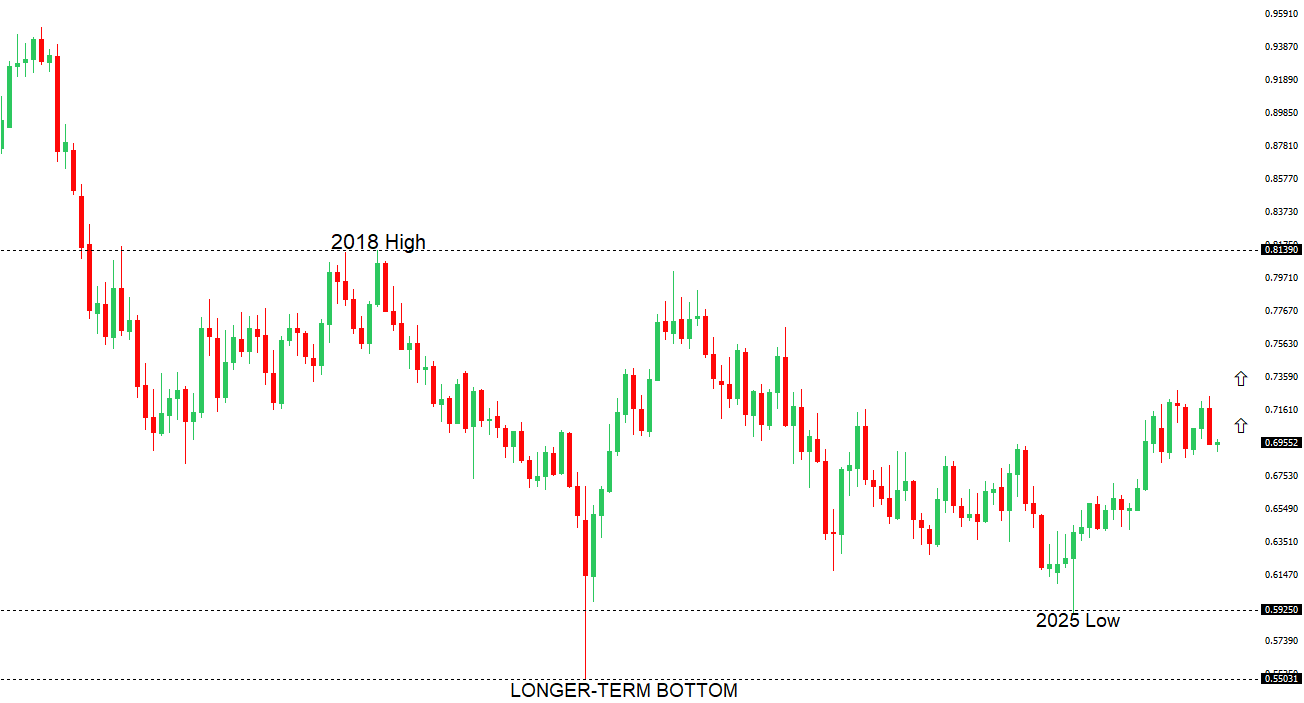 | ||
| R2 0.7142 - 15 September high - Strong R1 0.6995 - 30 September high - Medium S1 0.6904 - 1 October low - Medium S2 0.6865 - 30 June low - Strong | ||
| AUDUSD: fundamental overview | ||
| The Australian dollar remains under pressure into Thursday as hawkish Fed minutes reinforce expectations for further US tightening this year, supporting the greenback despite reduced odds of an October hike. Persistent US inflation concerns, echoed in hawkish Fed commentary, are keeping the policy outlook restrictive and weighing on the Aussie. Domestically, the possibility of another RBA increase offers some support, with former board member Ian Harper describing a November move as plausible, though markets still favor a hold. The balance leaves the currency sensitive to incoming inflation and employment data, with a stronger recovery likely to require either firmer expectations for Australian tightening or a softening in the US rate outlook. | ||
| Suggested reading | ||
| The New Math of AI: Are Those Trillion-Dollar Numbers for Real?, A. Bary, Barron’s (October 2, 2026) ‘Magnificent Seven’ ride to the rescue, J. Adinolfi, Marketwatch (October 6, 2026) | ||