


 | ||
| 16th November 2026 | view in browser | ||
| Chip stocks catch chill from treasuries | ||
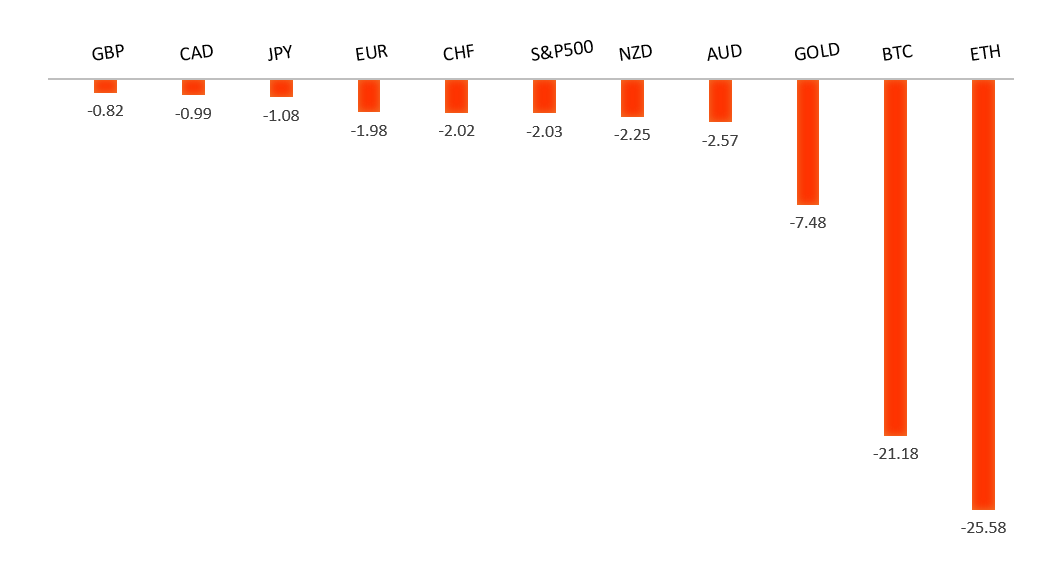
| The dollar starts the week on firm footing as Fed rate hike expectations keep Treasury yields elevated and renewed pressure on chip stocks weighs on Wall Street futures. | ||
| Performance chart 30day v. USD (%) | ||
 | ||
| Technical & fundamental highlights | ||
| EURUSD: technical overview | ||
| The Euro continues to show signs of wanting to carve out a major bottom after trading down to a 20-year low in 2022. Setbacks should be exceptionally well supported above 1.1000 on a weekly close basis ahead of the next major upside extension back above 1.2000. | ||
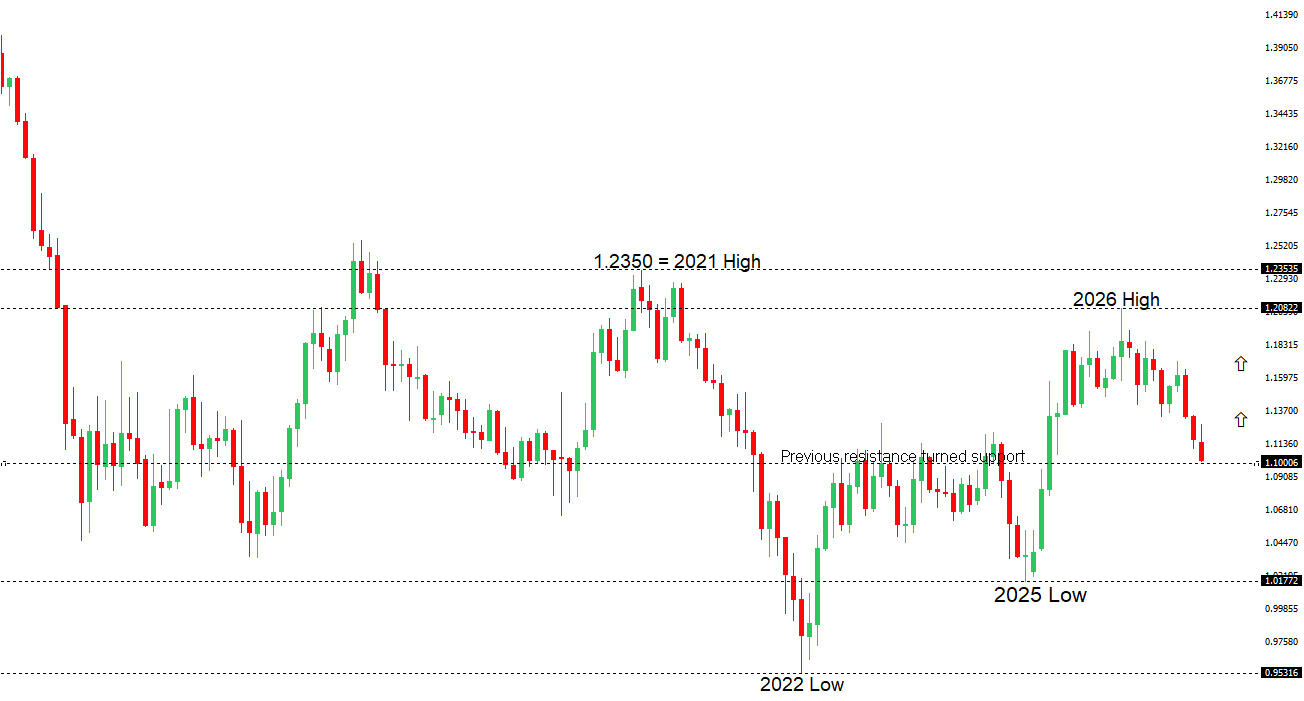 | ||
| R2 1.1274 - 4 November high - Strong R1 1.1171 - 11 November high - Medium S1 1.1012 - 16 November/2026 low - Medium S2 1.1000 - Psychological - Strong | ||
| EURUSD: fundamental overview | ||
| The euro has come under renewed pressure against the dollar, with EURUSD extending its decline into a fifth session and trading at its lowest since May 2025. Firm US inflation data and hawkish Fed commentary have reinforced expectations for a near-term US rate hike, keeping Treasury yields elevated, while geopolitical uncertainty has added to safe-haven demand for the dollar. The ECB’s increasingly hawkish stance has offered the euro little support as markets give greater weight to the prospect of tighter US policy. | ||
| GBPUSD: technical overview | ||
| The Pound remains exceptionally well supported on dips into the 1.3000 area, with the price largely consolidating above the psychological barrier and previous resistance turned support in the form of the 2023 high. Look for the market to continue be well supported on dips ahead of the next major upside extension through the yearly high at 1.3870 and towards a retest of the 2018 high at 1.4377 further up. Only a monthly close below 1.3000 negates. | ||
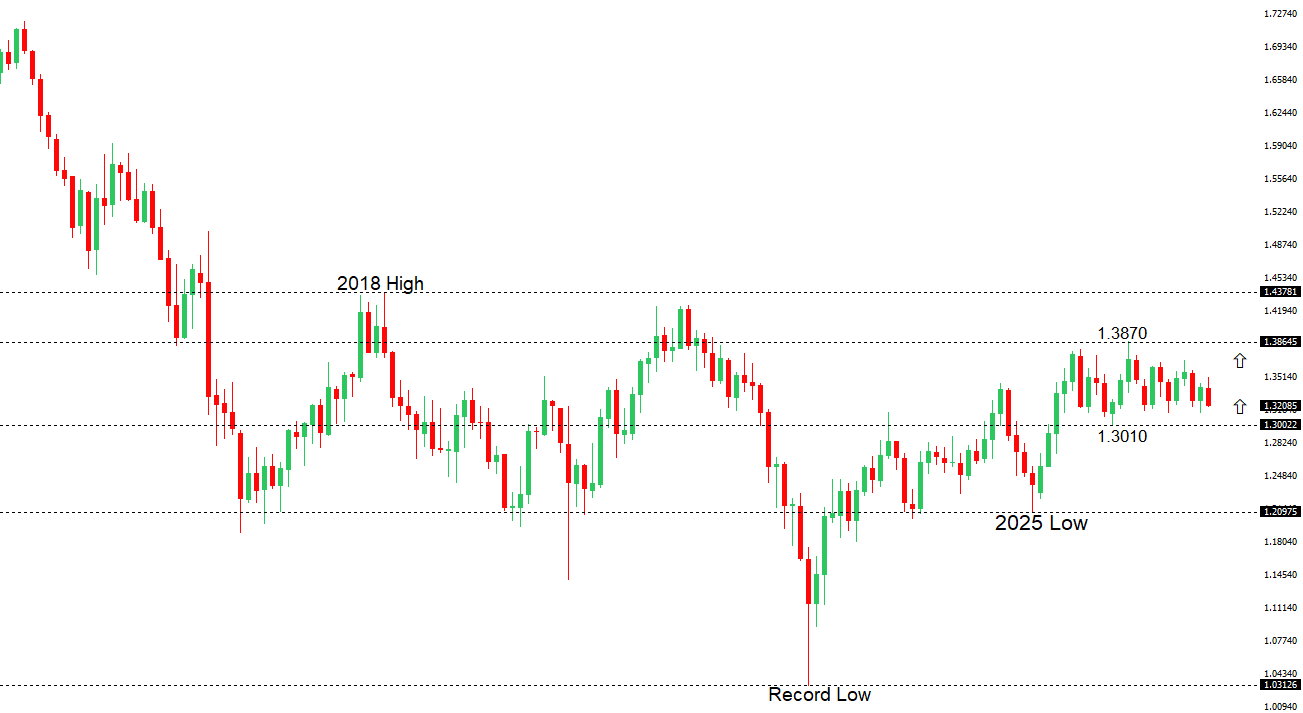 | ||
| R2 1.3419 - 22 October high - Medium R1 1.3356 - 11 November high - Medium S1 1.3202 - 16 November low - Medium S2 1.3137 - 14 October/2026 low - Strong | ||
| GBPUSD: fundamental overview | ||
| Sterling is lower for a fifth straight session against the US dollar as hotter-than-expected US inflation and hawkish Fed commentary have pushed markets to all but price in a December rate hike. UK fundamentals are offering the pound some support after third-quarter growth exceeded the Bank of England’s forecasts and Chief Economist Pill signaled that rates may need to rise again in December and further in 2027. For now, the repricing of US rates is driving the pair. Fed Chair Kevin Warsh speaks later Monday, with Tuesday’s UK jobs and wage data and US retail sales the next tests for rate expectations on both sides of the Atlantic. | ||
| USDJPY: technical overview | ||
| The recent breakdown below 155.00 suggests the market could be on the verge of a bigger structural shift, with the possibility for an end to a longer-term uptrend and the start to a period of persistent weakness. Critical support now comes in the form of the 2026 low from January at 151.97, with a drop below to strengthen the bearish outlook and open the door for a major downside extension targeting the 2024 low at 139.58. The market would to put in a weekly close back above 160.00 to take the immediate pressure off the downside. | ||
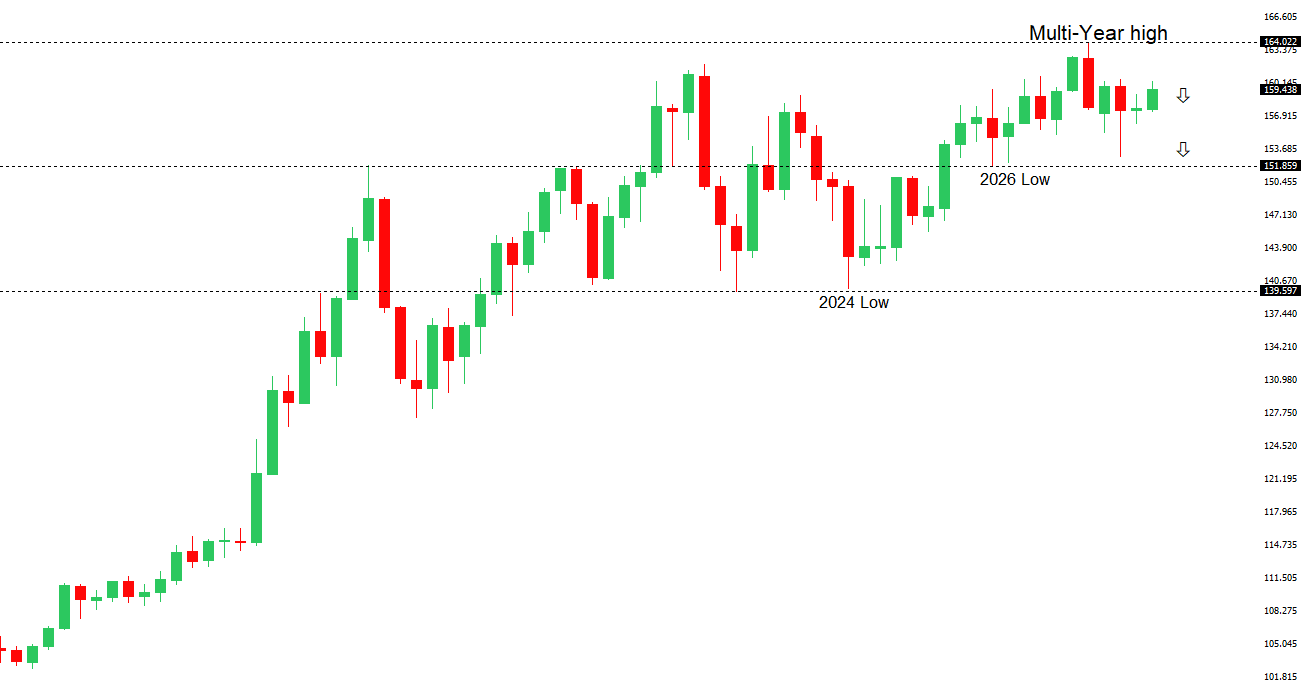 | ||
| R2 160.40 - 2 September high - Strong R1 160.19 - 13 November high - Medium S1 158.66 - 11 November low - Medium S2 156.96 - 30 October low - Strong | ||
| USDJPY: fundamental overview | ||
| The yen is hovering near two-month lows against the US dollar, with sticky US inflation and renewed expectations for Fed rate hikes keeping the dollar well supported. In Japan, softer-than-expected third-quarter GDP has done little to dislodge expectations of further Bank of Japan tightening. BoJ board member Takata reinforced the case for additional, data-dependent hikes, warning that a weaker yen can lift import costs and that those price increases are increasingly likely to spread through the broader economy. His remarks keep a December hike in play, while renewed intervention warnings from Tokyo are helping limit yen downside. A more sustained recovery may depend on whether Japanese rate expectations rise enough to narrow the yield gap with the US. | ||
| AUDUSD: technical overview | ||
| There are signs of the formation of a longer-term base with the market recovering out from a meaningful longer-term support zone. The latest monthly close back above 0.7000 takes the big picture pressure off the downside and strengthens the case for a bottom, with the focus now on a push towards 0.8000. Setbacks should now be well supported ahead of 0.6700. | ||
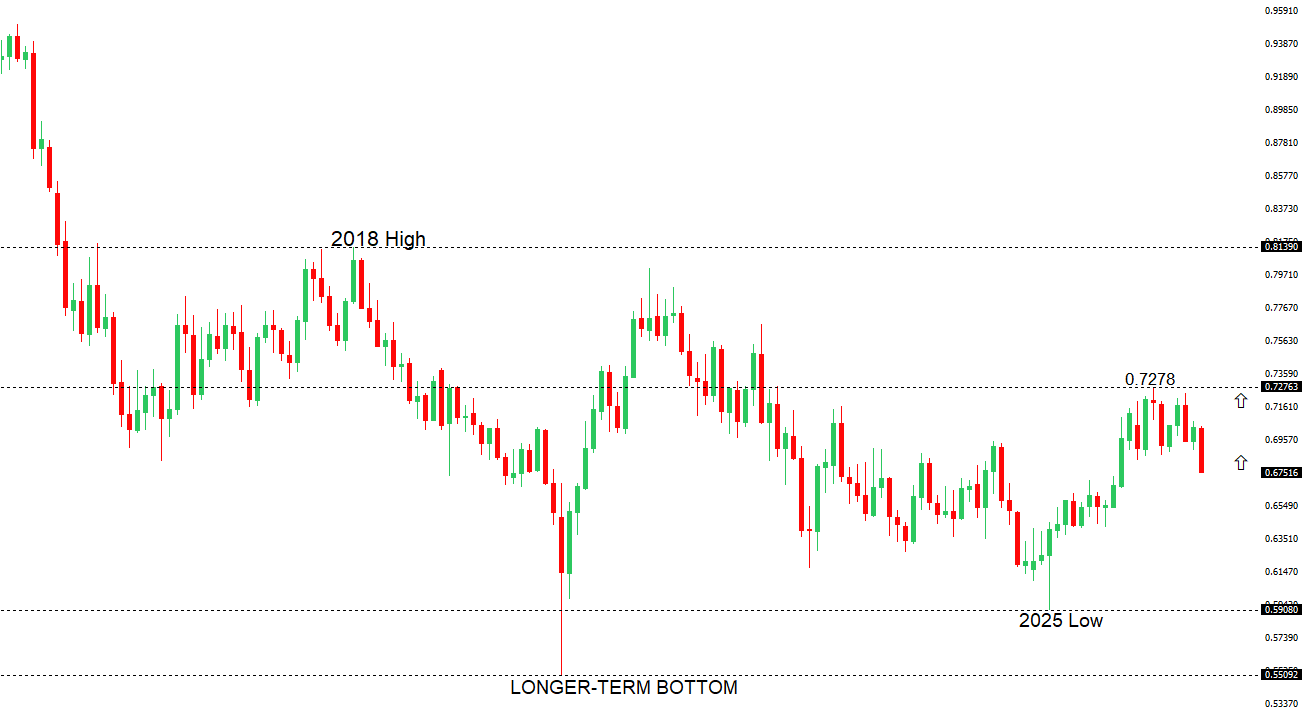 | ||
| R2 0.6886 - 11 November high - Medium R1 0.6815 - 13 November high - Medium S1 0.6750 - 16 November low - Medium S2 0.6663 - 5 January/2026 low - Strong | ||
| AUDUSD: fundamental overview | ||
| The Australian dollar remains under pressure near 10-month lows as weaker-than-expected Chinese data and rising US rate expectations weigh on the currency. China’s October retail sales and industrial production both slowed more than forecast, pointing to softer demand in Australia’s largest export market. At the same time, the support the Aussie drew from the RBA’s earlier rate hikes is fading as markets see limited scope for further tightening in Australia. Traders are pricing in a near-certain quarter-point Fed hike in December, with Kansas City Fed President Schmid reinforcing that view by warning that inflation is still running too hot. That shift in relative rate expectations continues to favor the US dollar heading into US retail sales and the latest Fed minutes. | ||
| Suggested reading | ||
| The great British sell-off, J. Gapper, Financial Times (November 13, 2026) How Does Your Bear Market Thesis Hold Up?, J. Parets, Trend Labs (November 11, 2026) | ||