


 | ||
| 20th November 2026 | view in browser | ||
| Stocks extend slide but dollar bulls take profit | ||
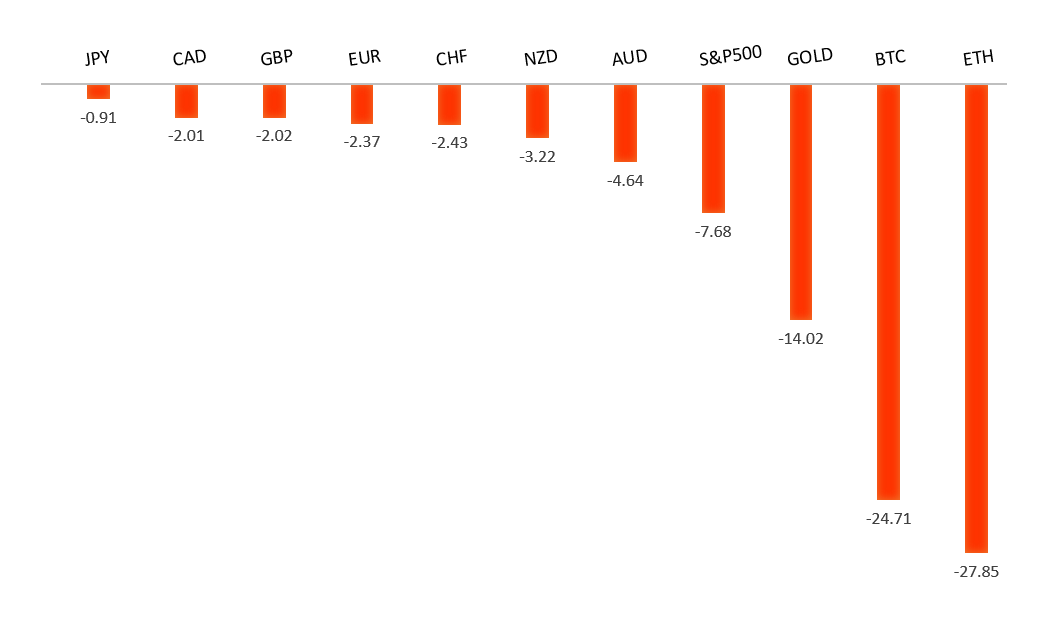
| The tech selloff is setting a defensive tone into Friday, with the dollar holding firm on Fed hike expectations, gold extending losses, and crude getting a lift from renewed supply concerns in the Strait of Hormuz. | ||
| Performance chart 30day v. USD (%) | ||
 | ||
| Technical & fundamental highlights | ||
| EURUSD: technical overview | ||
| The Euro continues to show signs of wanting to carve out a major bottom after trading down to a 20-year low in 2022. Setbacks should be exceptionally well supported above 1.1000 on a weekly close basis ahead of the next major upside extension back above 1.2000. | ||
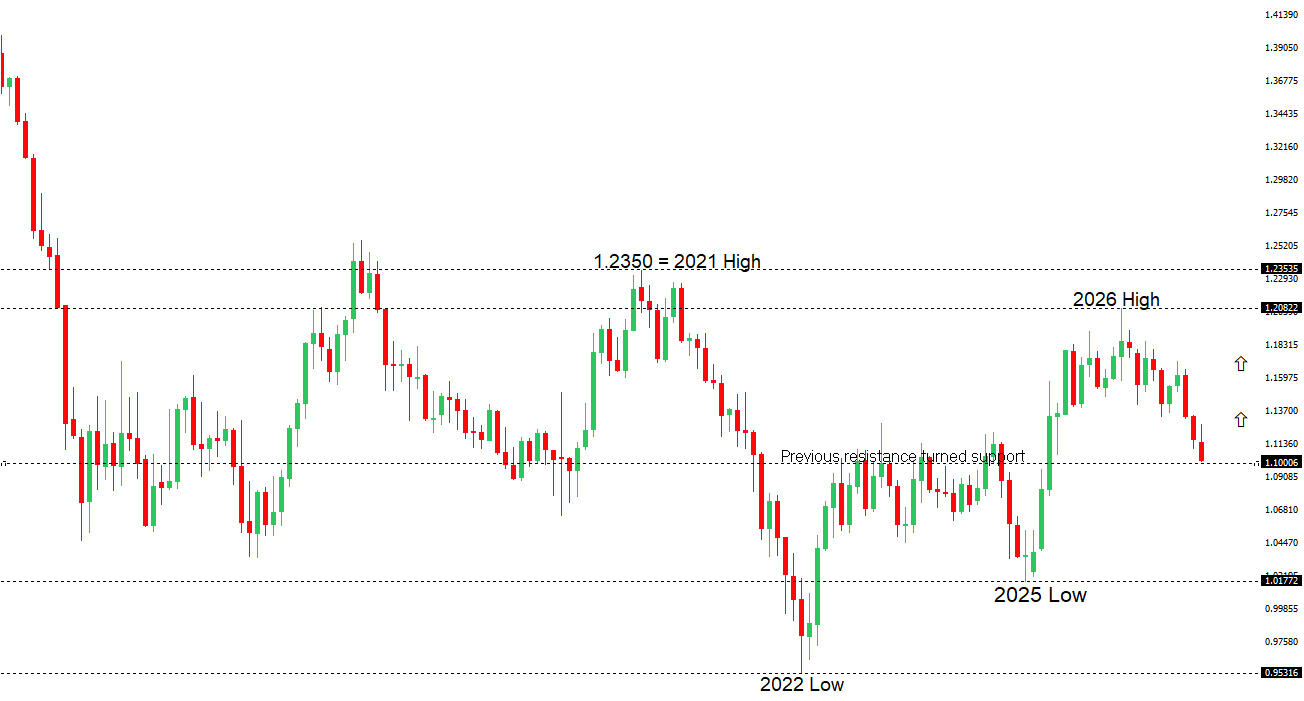 | ||
| R2 1.1103 - 12 November high - Medium R1 1.1073 - 13 November high - Medium S1 1.0953 - 18 November/2026 low - Strong S2 1.0900 - Figure - Medium | ||
| EURUSD: fundamental overview | ||
| The euro edged higher on Friday after closing at its weakest level against the dollar since April 2025, though the rebound remained modest. Hotter-than-expected US inflation and hawkish Fed commentary continue to support the dollar, with markets pricing in a quarter-point hike in December and Governor Christopher Waller making the case for considering a larger move. A selloff in European equities and a drop in short-term eurozone inflation expectations have also weighed on the euro, even as a December ECB hike remains in view. Friday’s focus turns to German producer prices, remarks from ECB President Christine Lagarde and Bundesbank President Joachim Nagel, and the University of Michigan’s US inflation expectations survey. | ||
| GBPUSD: technical overview | ||
| The Pound remains exceptionally well supported on dips into the 1.3000 area, with the price largely consolidating above the psychological barrier and previous resistance turned support in the form of the 2023 high. Look for the market to continue be well supported on dips ahead of the next major upside extension through the yearly high at 1.3870 and towards a retest of the 2018 high at 1.4377 further up. Only a monthly close below 1.3000 negates. | ||
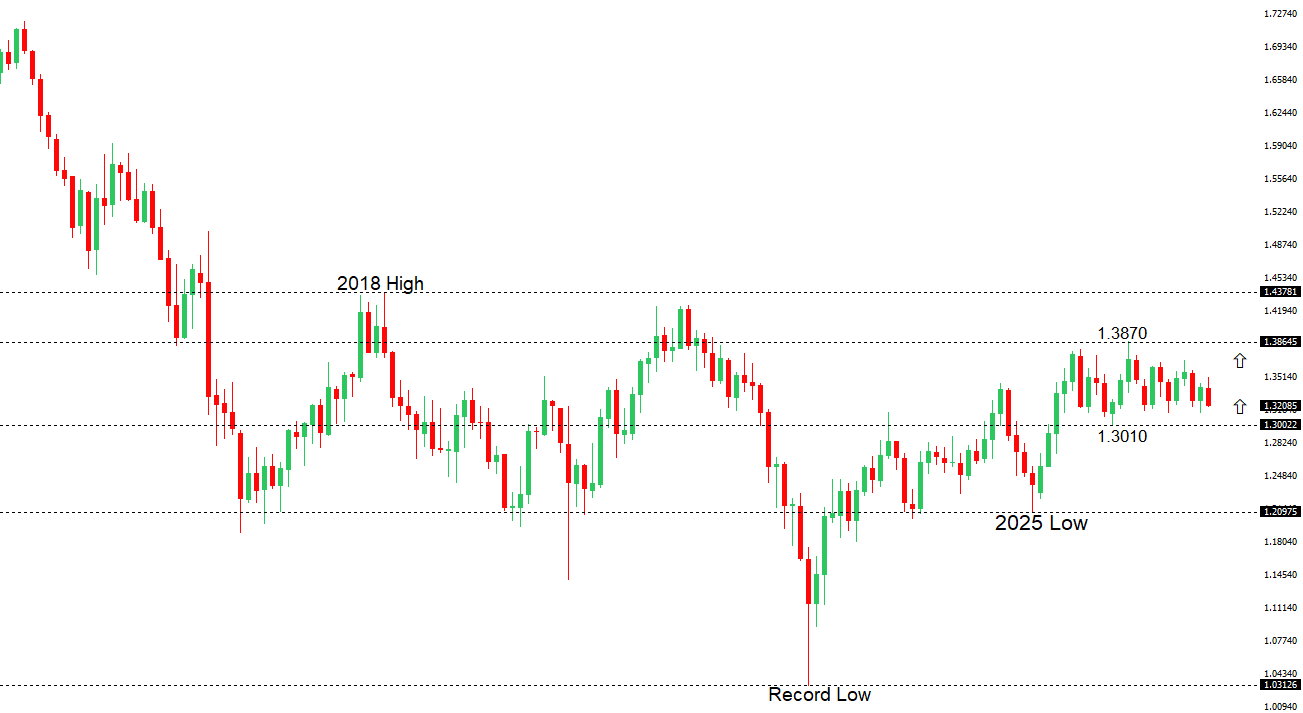 | ||
| R2 1.3283 - 12 November high - Medium R1 1.3228 - 17 November high - Medium S1 1.3078 - 20 November/2026 low - Medium S2 1.3000 - Psychological - Strong | ||
| GBPUSD: fundamental overview | ||
| The pound edged higher against the dollar on Friday after touching a fresh year-to-date low, helped by a pause in the dollar’s recent rally. Sterling remains under pressure from diverging rate expectations. Mixed UK inflation data tempered bets on another Bank of England hike, while hawkish Fed minutes reinforced expectations for a December hike and further tightening in early 2027. Renewed tensions in the Middle East continue to underpin safe-haven demand for the dollar, leaving UK retail sales as the next test of whether sterling can extend its rebound. | ||
| USDJPY: technical overview | ||
| The recent breakdown below 155.00 suggests the market could be on the verge of a bigger structural shift, with the possibility for an end to a longer-term uptrend and the start to a period of persistent weakness. Critical support now comes in the form of the 2026 low from January at 151.97, with a drop below to strengthen the bearish outlook and open the door for a major downside extension targeting the 2024 low at 139.58. The market would to put in a weekly close back above 160.00 to take the immediate pressure off the downside. | ||
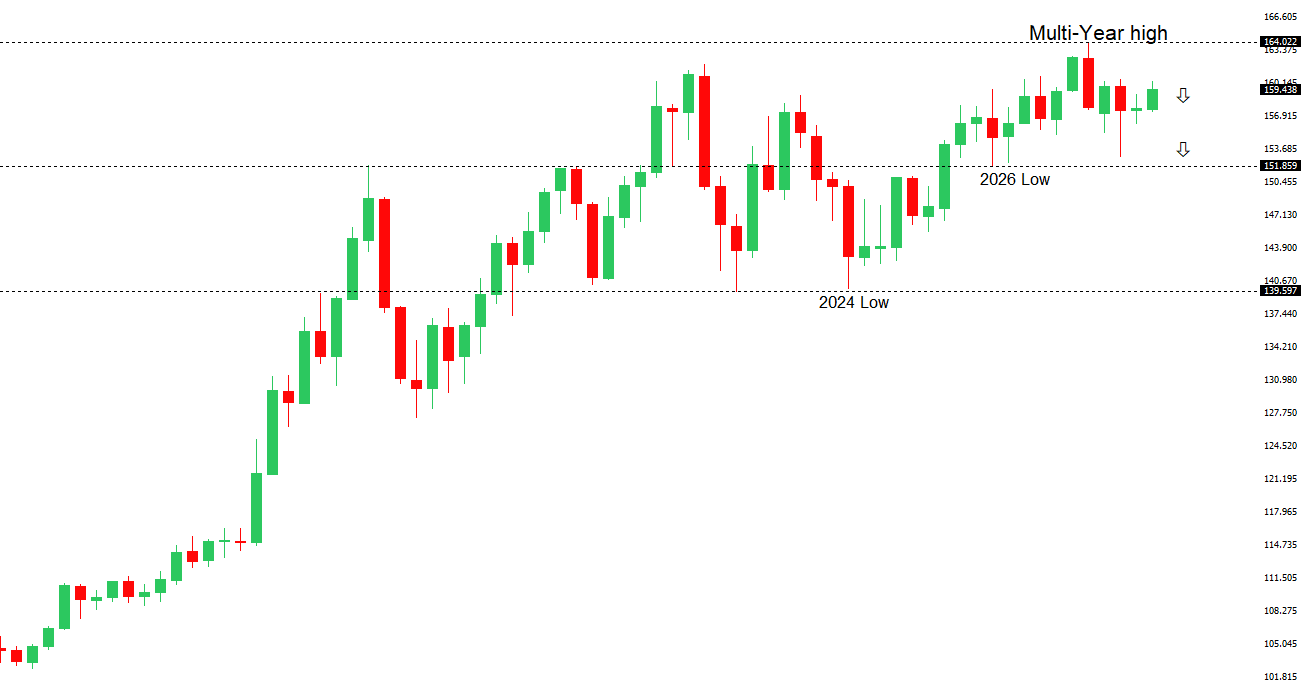 | ||
| R2 160.40 - 2 September high - Strong R1 160.19 - 13 November high - Medium S1 158.87 - 17 November low - Medium S2 156.96 - 30 October low - Strong | ||
| USDJPY: fundamental overview | ||
| The yen edged higher on Friday after Japanese inflation picked up in October, reinforcing expectations for a Bank of Japan rate hike in December. Headline inflation accelerated to 2.3% year over year, while core inflation excluding fresh food rose to 2.2%, slightly below consensus but above the BoJ’s 2% target for a second straight month. Inflation excluding fresh food and energy eased, and the third-quarter contraction in GDP still argues for a gradual pace of tightening. Governor Kazuo Ueda nevertheless reiterated that the BoJ intends to keep raising rates as financial conditions remain accommodative, warning that a weaker yen could add to inflation pressures. Higher US yields continue to limit the yen’s recovery, while the risk of Japanese intervention is likely to temper further dollar gains. | ||
| AUDUSD: technical overview | ||
| There are signs of the formation of a longer-term base with the market recovering out from a meaningful longer-term support zone. Setbacks should now be well supported ahead of 0.6600, with the focus now on a higher low ahead of the next big push towards 0.8000. | ||
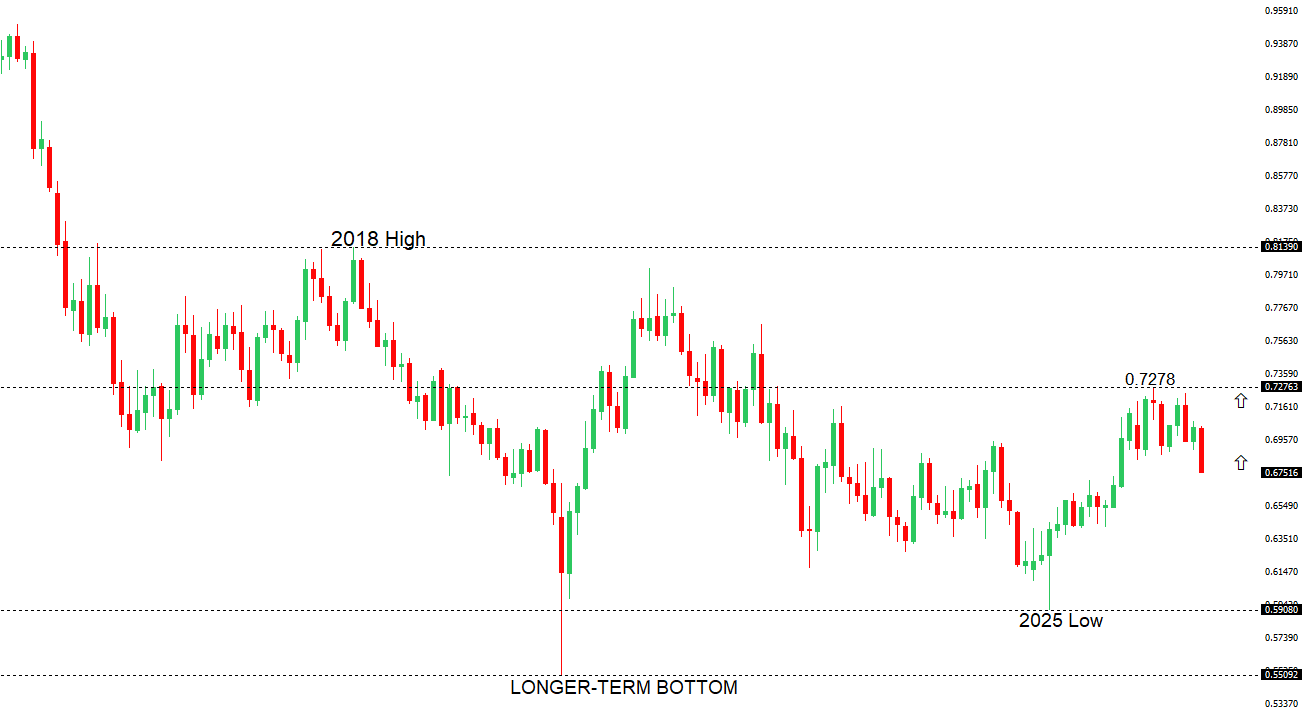 | ||
| R2 0.6886 - 11 November high - Medium R1 0.6815 - 13 November high - Medium S1 0.6645 - 20 November/2026 low - Strong S2 0.6600 - Figure - Strong | ||
| AUDUSD: fundamental overview | ||
| The Australian dollar remains under pressure as a weaker domestic labor market and a hawkish Fed pull rate expectations in opposite directions. Australia’s unemployment rate rose to 4.9%, the highest since late 2021, reinforcing expectations that the RBA will hold in December and fueling bets that its next move could be a cut in 2027. China’s widely expected decision to leave benchmark lending rates unchanged offered little support for the Aussie. Meanwhile, hawkish Fed minutes and policymaker comments have left markets pricing in a December rate hike, keeping the US dollar supported. | ||
| Suggested reading | ||
| The man who sold a fake country, R. Wigglesworth, Financial Times (November 18, 2026) The Silver Lining of a Data-Center Slowdown, R. Rajan, Project Syndicate (November 17, 2026) | ||