


 |
|
8 April 2024 A closer look at ETH relative to BTC |
| LMAX Digital performance |
|
Total notional volume at LMAX Digital improved in the previous week. Total notional volume from last Monday through Friday came in at $3.4 billion, 10% higher than a week earlier. Breaking it down per coin, bitcoin volume came in at $1.79 billion in the previous week, 6% higher than the week earlier. Ether volume came in at $938 million, 15% higher than the week earlier. Total notional volume over the past 30 days comes in at $20.2 billion. Looking at average position size over the past 30 days, we’re seeing average bitcoin position size at $8,639 and average position size for ether at $4,639. Market volatility has been in cool down mode since peaking in Mid-March. We’re looking at average daily ranges in bitcoin and ether of $3,030 and $178 respectively. |
| Latest industry news |
|
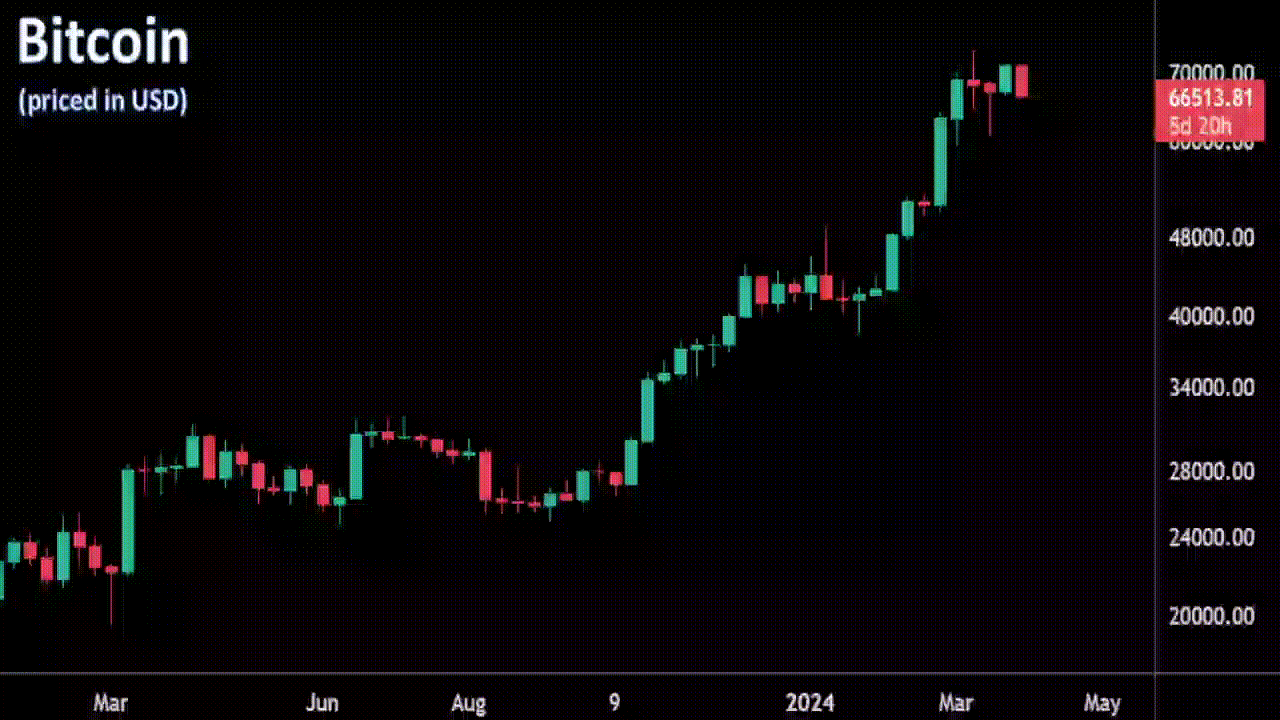
Things are relatively quiet as the new week gets going. Overall, bitcoin has held up exceptionally well into support. At the same time, we remain in a period of consolidation that could still translate to corrective price action before we see the next run of fresh record highs. Technically speaking, the daily chart shows a possible lower top around $71,800, below the record high from mid-March. This means that while we trade below $71,800, the market could be considering deeper setbacks. We were surprised to see currencies hold up so well against the US Dollar in the aftermath of the strong US employment report. We believe this price action was also a benefit to bitcoin, given the broad currency demand against the Buck. But the takeaway from Friday’s data was that the Fed would have added pressure to steer away from 3 full rate cuts in 2024. With that said, we would be on the lookout for yield differentials to move back to the Buck, which could have a short-term weighing influence on the price of bitcoin. Ultimately, as we’ve said many times, we don’t expect bitcoin to trade under too much pressure in a risk off setting, as market participants quickly realize the value of increasing bitcoin exposure in a flight to safety environment. One chart we’re keeping an eye on right now is the ETHBTC chart. This rate is gravitating back to the yearly low from January, below which takes it to the lowest levels since April 2021. Whenever ETH is underperforming relative to bitcoin, it’s a sign that the risk environment is less friendly. If we do see additional downside pressure on this chart, it could warn that sentiment deterioration is at risk of intensifying. At the same time, it’s also possible some of this bitcoin outperformance relative to bitcoin is less about risk sentiment and more about overwhelming demand for bitcoin in the aftermath of the bitcoin spot ETF approvals. It’s too early to tell right now, and we will look to the ETHBTC yearly low level from January for a better indication. If the market can hold up above that level, it will send a more encouraging sign about overall sentiment in the crypto space. |
| LMAX Digital metrics | ||||
|
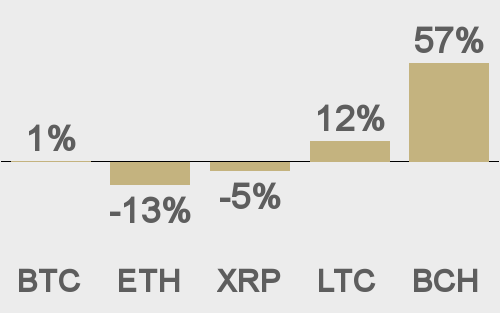
Price performance last 30 days avg. vs USD (%) |
||||
 |
||||
|
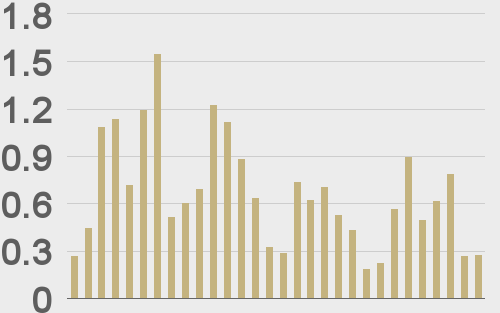
Total volumes last 30 days ($bn) |
||||
 |
||||
|
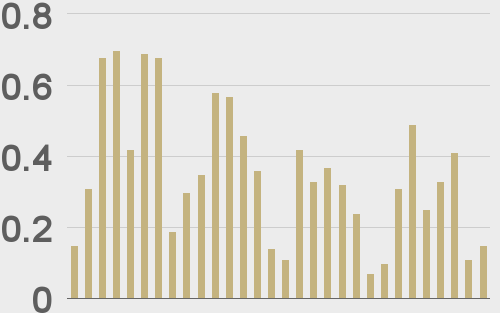
BTCUSD volumes last 30 days ($bn) |
||||
 |
||||
|
BTCUSD avg. trade size last 30 days ($k) |
||||
 |
||||
|
ETHUSD avg. trade size last 30 days ($k) |
||||
 |
||||
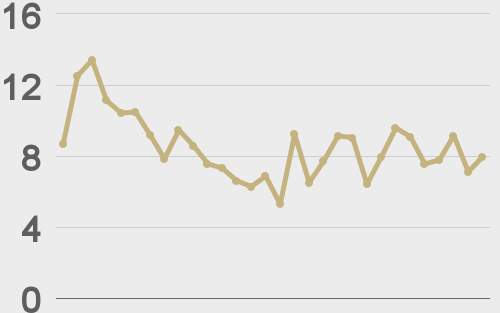
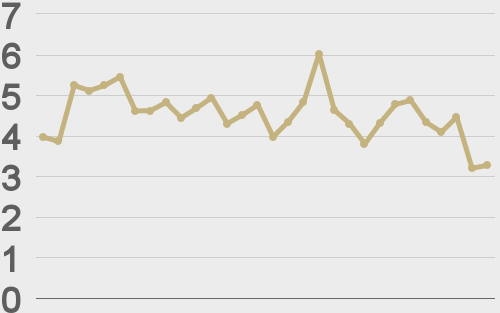
| Average daily range | ||||
|
||||
|
||||
|
|
||||
|
@TheBlock__ |
||||
|
@teddyfuse |
||||
| Crypto Bulletin sign-up | ||||
| Subscribe | ||||