


 |
|
18 July 2022 Seasonality trends encourage bounce |
| LMAX Digital performance |
|
Total notional volume at LMAX Digital trended quite a bit lower in the previous week, consistent with what we are seeing in the broader market. Total notional volume from Monday through Friday came in at $1.3 billion, 33% lower than the week earlier. Breaking it down per coin, Bitcoin volume came in at $812 million in the previous week, off 40% from a week earlier. Ether volume dropped to $341 million, down 28% from the week earlier. Total notional volume over the past 30 days comes in at $12.3 billion. Looking at average position size over the past 30 days, we’re seeing average bitcoin position size at $5,991 and average position size for ether at $2,150. Volatility continues to hold at yearly low levels. We’re looking at average daily ranges in bitcoin and ether of $1,124 and $99 respectively. |
| Latest industry news |
|
There has been some encouraging price action in recent sessions, though we still believe the price action should be taken with a grain of salt. Indeed, ether has broken out above a multi-session consolidation. But with bitcoin failing to do the same as of yet, there really is no confirmation of legitimate bullish price action. In our view, we need to see bitcoin making that breakout and establishing back above $23,000 to suggest there is something going on as far as pressure being taken off the downside. Fundamentally, there as been a pickup in risk sentiment, with US equities turning back up and the US Dollar selling off. It seems the primary driver has been scaled back Fed rate hike expectations, with the market no longer seriously considering a 100 basis point rate hike from the Fed this month, in lieu of last week’s softer inflation expectations data from the University of Michigan read. We’ve also seen data showing bitcoin miner reserves dropping to their lowest levels in about a year, something that often coincides with price reversal. And finally, from a seasonality standpoint, July has historically been a bullish month for bitcoin. If we look back since 2015, there have only been 2 bearish July months over that time, with bitcoin up an average of 11.4% in Julys from 2015 to present. |
| LMAX Digital metrics | ||||
|
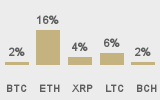
Price performance last 30 days avg. vs USD (%) |
||||
 |
||||
|
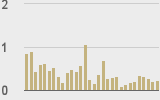
Total volumes last 30 days ($bn) |
||||
 |
||||
|
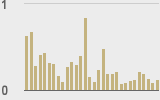
BTCUSD volumes last 30 days ($bn) |
||||
 |
||||
|
BTCUSD avg. trade size last 30 days ($k) |
||||
 |
||||
|
ETHUSD avg. trade size last 30 days ($k) |
||||
 |
||||
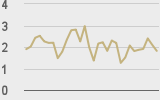
| Average daily range | ||||
|
||||
|
||||
|
|
||||
|
@BTCTN |
||||
|
@TheBlock__ |
||||
| Crypto Bulletin sign-up | ||||
| Subscribe | ||||