


 |
|
15 February 2023 Volume rockets higher |
| LMAX Digital performance |
|
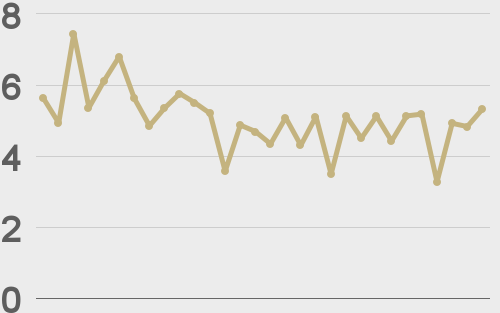
LMAX Digital volumes shot up in a big way on Tuesday. Total notional volume for Tuesday came in at $520 million, 47% above 30-day average volume. Bitcoin volume printed $292 million on Tuesday, 60% above 30-day average volume. Ether volume printed $156 million, 54% above 30-day average volume. Looking at average position size over the past 30 days, we’re seeing average bitcoin position size at $5,210 and average position size for ether at 3,069. Volatility has cooled from recent peaks, but overall, has turned up a good deal from multi-month lows we were seeing in 2022. We’re looking at average daily ranges in bitcoin and ether of $653 and $66 respectively. |
| Latest industry news |
|
It’s been a bit of a whacky week when it comes to crypto and familiar correlations. Those have kind of gone out the window of late. On Monday, stocks were charging higher while crypto was under pressure. And on Tuesday it was crypto rallying while stocks were getting sold. We believe a lot of this has to do with market specific developments. Crypto had been hit on Monday despite the bullish price action in stocks, as it was suffering from anxiety around the SEC and regulatory crackdowns. On Tuesday, stocks sold off from the hotter than expected US inflation data, and crypto did not want to participate, instead heading higher. We believe this to be the case because worry around the regulatory crackdown had calmed down, and other positive industry specific news hit the wires. It was revealed that major players in the traditional financial markets world were building exposure in Silvergate. This included Citadel Securities, Susquehanna Advisors, and George Soros’ fund. The Soros fund also added exposure to existing bets on Marathon Digital and MicroStrategy. Looking ahead, we think broader markets will still be worrying about the implications of higher rates in the US. And this could still have a weighing influence on crypto prices if stocks start to accelerate to the downside. Technically speaking, as we’ve been highlighting already this week, the bitcoin chart continues to look a little top heavy, and like it could be in the process of rolling over for deeper setbacks. |
| LMAX Digital metrics | ||||
|
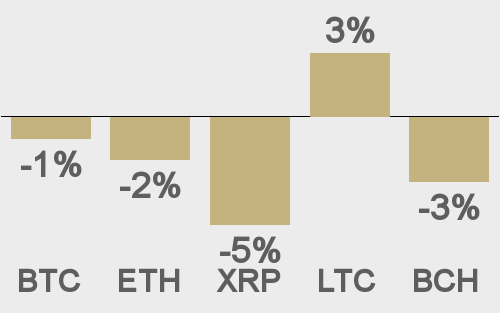
Price performance last 30 days avg. vs USD (%) |
||||
 |
||||
|
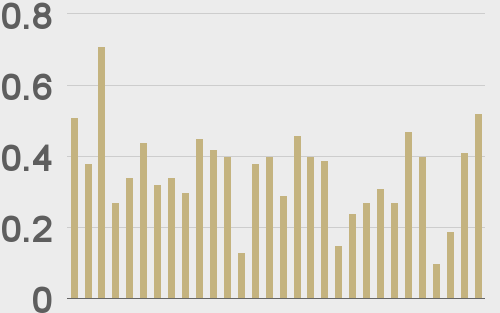
Total volumes last 30 days ($bn) |
||||
 |
||||
|
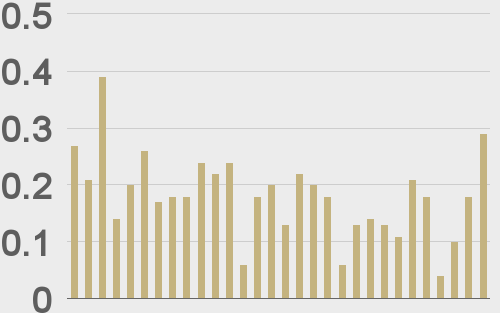
BTCUSD volumes last 30 days ($bn) |
||||
 |
||||
|
BTCUSD avg. trade size last 30 days ($k) |
||||
 |
||||
|
ETHUSD avg. trade size last 30 days ($k) |
||||
 |
||||
| Average daily range | ||||
|
||||

|
||||
|
|
||||
|
@TheBlock__ |
||||
|
@crypto |
||||
| Crypto Bulletin sign-up | ||||
| Subscribe | ||||