


 | ||
| 14th May 2025 | view in browser | ||
| Cautious optimism fuels risk-on | ||
| In a landscape marked by cautious optimism, investors are gently embracing a risk-on sentiment, buoyed by progress in U.S. trade negotiations with key partners and a lack of immediate economic catalysts, though uncertainty lingers over the Trump administration’s tariff policies. | ||
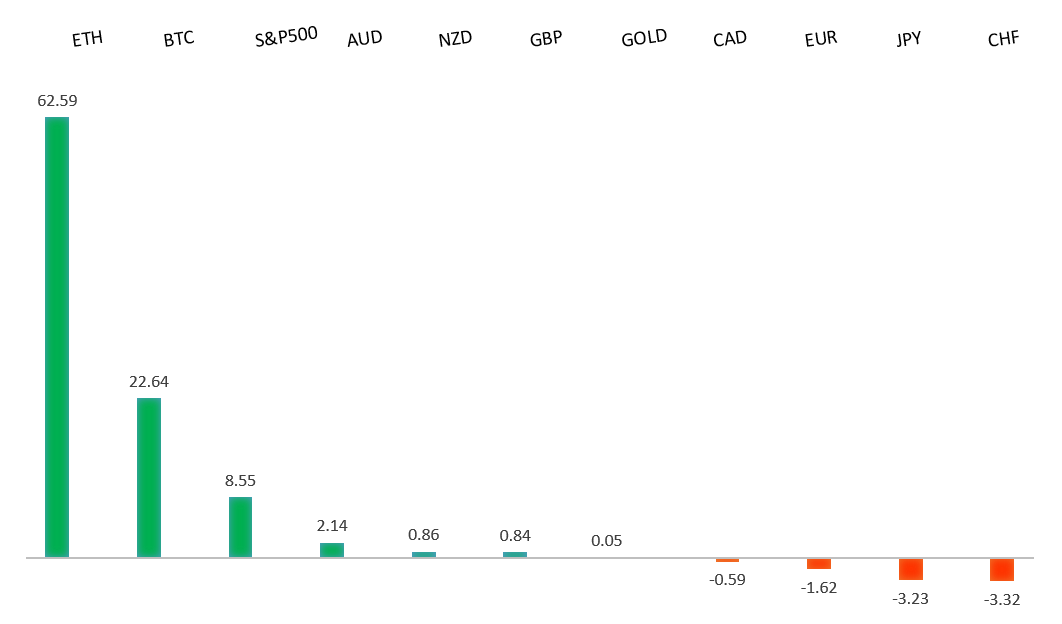
| Performance chart 30day v. USD (%) | ||
 | ||
| Technical & fundamental highlights | ||
| EURUSD: technical overview | ||
| The Euro has finally broken out from a multi-month consolidation off a critical longer-term low. This latest push through the 2023 high lends further support to the case for a meaningful bottom, setting the stage for a bullish structural shift and the next major upside extension targeting the 2021 high at 1.2350. Setbacks should be exceptionally well supported below 1.1000. | ||
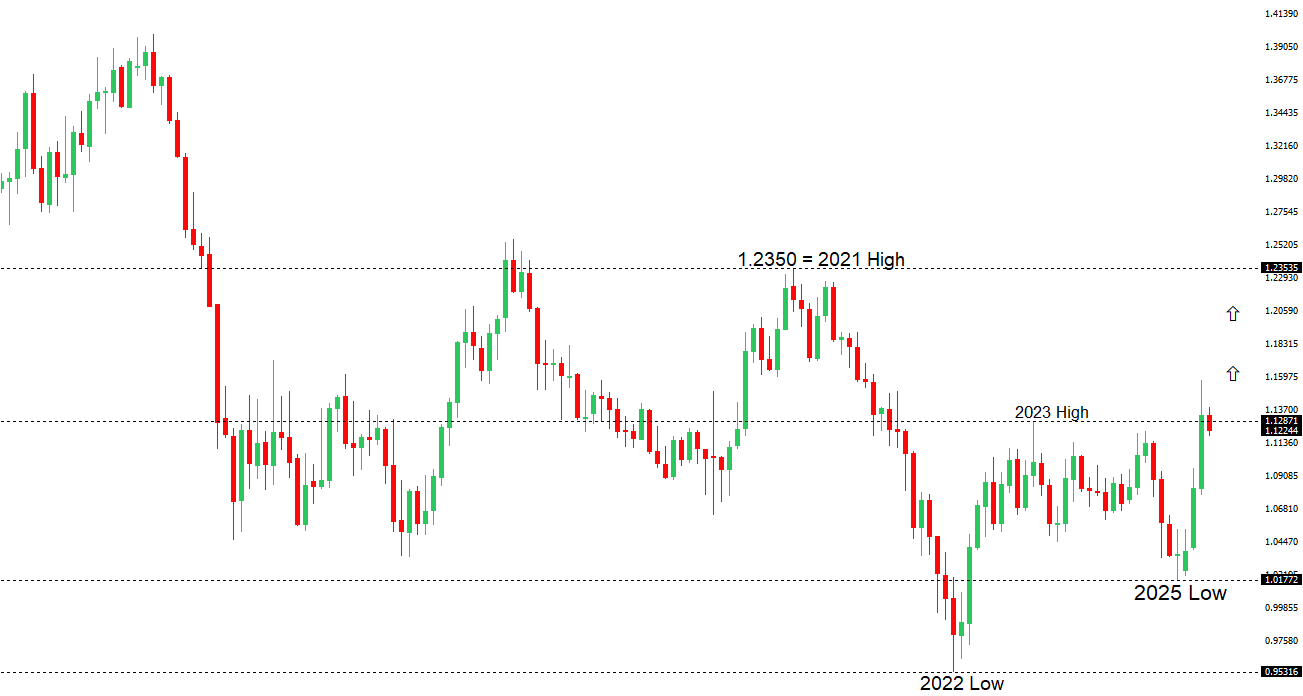 | ||
| R1 1.1293 - 9 May high - Medium R1 1.1243 - 12 May high - Medium S1 1.1065 - 12 May low - Medium S2 1.1000 - Psychological - Strong | ||
| EURUSD: fundamental overview | ||
| U.S. Treasury Secretary Bessent’s remarks suggest trade negotiations with the EU face challenges due to a “collective action problem,” hinting at stalled progress and a lower priority for a swift deal, possibly reflecting the Trump administration’s aggressive stance amid favorable market conditions. Despite this, Bessent remains optimistic about eventual resolution, while the administration’s “good cop, bad cop” tactic—marked by Trump’s bold tariff threats and Bessent’s calming assurances—signals uncertainty in policy direction, with markets wary of potential 1.5–2.0% GDP contraction if reciprocal tariffs resume. In Europe, Germany’s ZEW Expectations Index surged to 25.2 in May, buoyed by softened U.S.-China tariffs, ECB easing, and Chancellor Merz’s fiscal expansion plans, though the ZEW Current Situation Index at -82.0 underscores ongoing manufacturing and infrastructure challenges. Potential Istanbul peace talks involving Trump, Putin, and Zelensky could further reduce geopolitical risks, boosting the euro, while Russia faces additional EU sanctions if talks falter. | ||
| USDJPY: technical overview | ||
| There are signs of a meaningful top in place after the market put in a multi-year high in 2024. At this point, the door is now open for a deeper setback below the 2024 low at 139.58 over the coming sessions exposing a retest of the 2023 low. Rallies should be well capped below 150.00. | ||
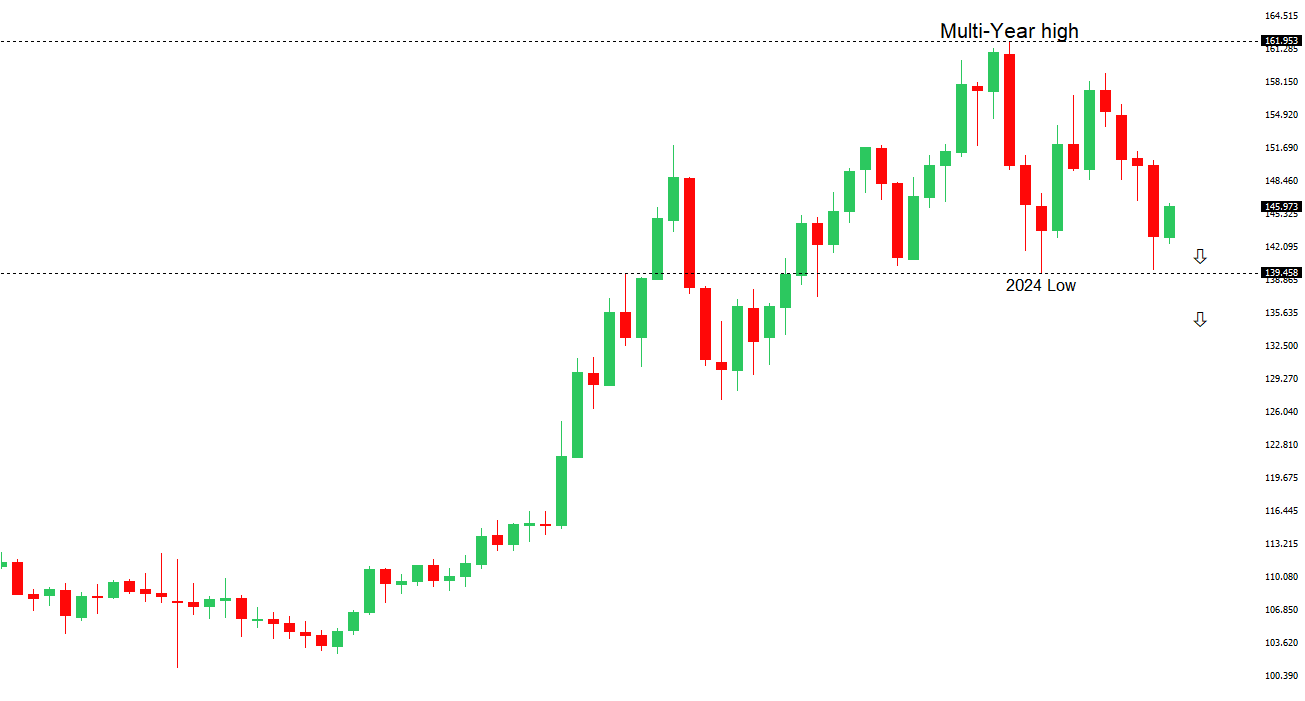 | ||
| R2 150.00 - Psychological - Strong R1 148.65 - 12 May high - Medium S1 145.70 - 12 May low - Medium S1 144.82 - 9 May low - Medium | ||
| USDJPY: fundamental overview | ||
| A significant de-escalation in U.S.-China trade tensions, marked by a 90-day tariff pause, has invigorated global risk appetite, prompting traders to scale back record-high net yen longs (176,859 contracts, CFTC, May 6, 2025) and bolstering the Chinese yuan to a six-month high, reflecting optimism in China’s export prospects. Japan’s Finance Minister Kato’s planned currency discussions with U.S. Treasury Secretary Bessent at the G7 meeting in Canada, alongside softer U.S. CPI data and President Trump’s push for Federal Reserve rate cuts, have fueled hopes for yen stabilization, potentially allowing modest appreciation without undermining Japan’s export competitiveness. Prime Minister Ishiba aims for a U.S. trade agreement by July 2025, contingent on resolving auto tariffs, which could clear the path for Bank of Japan rate hikes, while Japan’s April PPI (4.0% YoY, 0.2% MoM) signals easing inflation, supporting the BOJ’s cautious stance amid strengthening Asia ex-Japan market share. | ||
| AUDUSD: technical overview | ||
| There are signs of the potential formation of a longer-term base with the market trading down into a meaningful longer-term support zone. Only a monthly close below 0.5500 would give reason for rethink. A monthly close back above 0.7000 will take the big picture pressure off the downside and strengthen case for a bottom. | ||
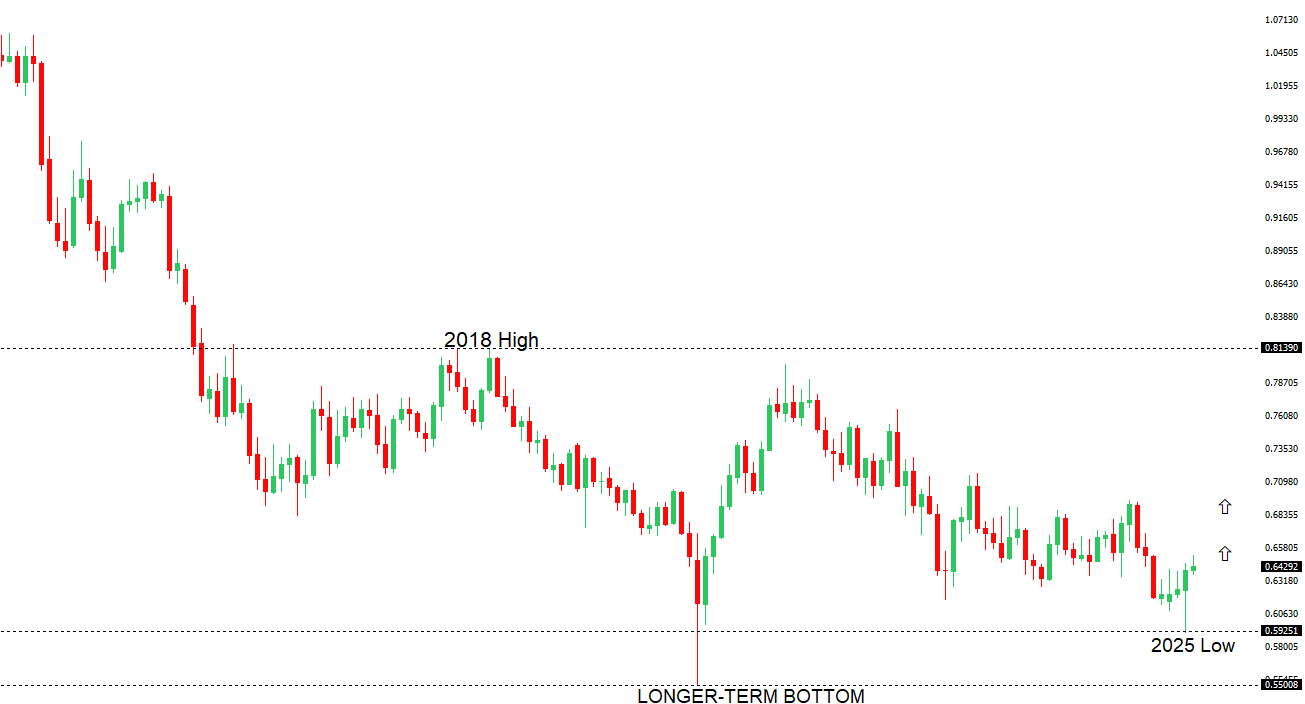 | ||
| R2 0.6550 - 25 November high - Strong R1 0.6515 - 7 May/2025 high - Medium S1 0.6344 - 24 April low - Medium S1 0.6275 - 14 April low - Strong | ||
| AUDUSD: fundamental overview | ||
| The de-escalation of U.S.-China trade tensions, highlighted by a 90-day tariff pause, promises greater economic growth benefits for the global economy than for the U.S., as noted by Deutsche Bank’s George Saravelos, while the People’s Bank of China’s fixing of the yuan at a robust 7.1991 USDCNY—the strongest since April—bolsters the Chinese currency and supports antipodean currencies like the Australian dollar. In Australia, steady inflation within the Reserve Bank of Australia’s 2–3% target band fuels expectations for a rate cut on May 20, 2025, though reduced tariff pressures have scaled back anticipated 2025 cuts from 100 to 79 basis points, reflecting optimism in regional growth. The first quarter’s Wage Price Index rose 3.4% year-on-year, signaling persistent labor market tightness within RBA projections, while a 1.6% quarterly decline in home loan values underscores housing market challenges, reinforcing Governor Bullock’s commitment to data-driven policy in this dynamic trade environment. | ||
| Suggested reading | ||
| The $40bn bitcoin bet, K. Martin, Financial Times (May 14, 2025) The Economics of Oil Refinery Shutting Down In California, M. Bernick, Forbes (May 13, 2025) | ||